How to Calculate Diffusion Coefficients with the Randles-Ševčík Equation: A Practical Guide for Electroanalytical Research
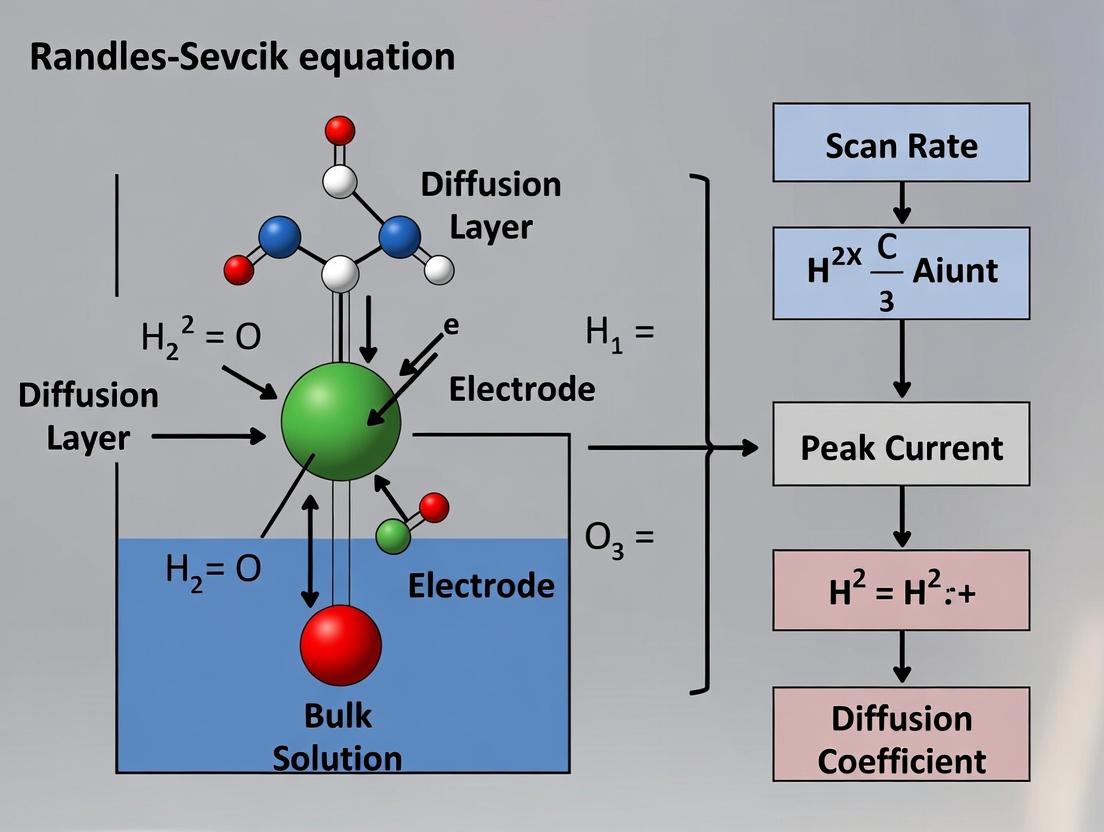
This comprehensive guide details the application of the Randles-Ševčík equation for calculating diffusion coefficients, a critical parameter in electrochemical research and drug development.
How to Calculate Diffusion Coefficients with the Randles-Ševčík Equation: A Practical Guide for Electroanalytical Research
Abstract
This comprehensive guide details the application of the Randles-Ševčík equation for calculating diffusion coefficients, a critical parameter in electrochemical research and drug development. It covers the fundamental theory and assumptions behind the equation, a step-by-step methodological protocol for data acquisition and analysis, common troubleshooting and optimization strategies for accurate results, and a comparative analysis with other techniques. Designed for researchers and scientists, this article provides the practical knowledge needed to reliably determine diffusion coefficients for molecules in solution, supporting applications from sensor design to pharmaceutical analysis.
Understanding the Randles-Ševčík Equation: Theory, Assumptions, and Core Principles
Cyclic voltammetry (CV) is a foundational electroanalytical technique used to study redox processes, electron transfer kinetics, and diffusion mechanisms. Within the context of research focused on applying the Randles-Ševčík equation for diffusion coefficient calculation, understanding the relationship between scan rate, peak current, and analyte concentration is paramount. This protocol details the experimental and analytical steps for utilizing CV data to extract quantitative diffusion coefficients, critical for applications in pharmaceutical development, such as characterizing drug molecule redox properties.
The Randles-Ševčík Equation and Quantitative Data
The peak current (ip) for a reversible, diffusion-controlled redox system is described by the Randles-Ševčík equation. The following table summarizes its forms and key parameters for calculating the diffusion coefficient (D).
Table 1: Forms of the Randles-Ševčík Equation and Key Constants
| Equation Form | Constants & Variables | Typical Units | Application Context |
|---|---|---|---|
| ip = (2.69×10⁵) n3/2 A D1/2 C v1/2 | ip = peak current (A) n = number of electrons transferred A = electrode area (cm²) D = diffusion coefficient (cm²/s) C = bulk concentration (mol/cm³) v = scan rate (V/s) | A, cm², cm²/s, mol/cm³, V/s | Standard form at 25°C (298 K) |
| ip = k n3/2 A D1/2 C v1/2 | k = 2.69×10⁵ (at 25°C) k = (2.65×10⁵) at 20°C k = (2.72×10⁵) at 30°C | As above | Temperature-adjusted calculations |
Table 2: Expected Relationship of Peak Current with Experimental Variables (Diagnostic for Diffusion Control)
| Variable Changed | Expected Change in ip (Reversible, Diffusion-Limited) | Deviation Implies |
|---|---|---|
| Scan Rate (v) | ip ∝ v1/2 (Linear ip vs. v1/2 plot) | Adsorption or kinetic limitations |
| Concentration (C) | ip ∝ C (Linear ip vs. C plot) | Non-ideal behavior or saturation |
| Electrode Area (A) | ip ∝ A (Linear ip vs. A plot) | Incorrect electrode geometry/cleaning |
Experimental Protocol: Determining Diffusion Coefficient via Randles-Ševčík Analysis
Objective
To determine the diffusion coefficient (D) of a redox-active pharmaceutical compound (e.g., acetaminophen) using cyclic voltammetry and the Randles-Ševčík equation.
Materials & Reagents (The Scientist's Toolkit)
Table 3: Key Research Reagent Solutions and Materials
| Item | Function / Specification | Example / Notes |
|---|---|---|
| Working Electrode | Surface for redox reaction. Requires precise area. | Glassy Carbon (3 mm diameter, A ≈ 0.0707 cm²). Polish before each use. |
| Reference Electrode | Provides stable, known potential reference. | Ag/AgCl (3M KCl) or Saturated Calomel Electrode (SCE). |
| Counter Electrode | Completes the electrical circuit. | Platinum wire or coil. |
| Supporting Electrolyte | Minimizes solution resistance, carries current. | 0.1 M Phosphate Buffer Saline (PBS), pH 7.4. Must be inert in potential window. |
| Analyte Stock Solution | Redox-active compound under study. | 50 mM acetaminophen in supporting electrolyte or suitable solvent. |
| Redox Standard (K₃[Fe(CN)₆]) | Validation of electrode function and area. | 1-5 mM in 1.0 M KCl. D ~ 7.6×10⁻⁶ cm²/s at 25°C. |
| Purification Gas | Removes dissolved oxygen, an electroactive interferent. | High-purity Nitrogen or Argon, degassed for 15+ minutes. |
| Polishing Kit | Ensines reproducible, clean electrode surface. | Alumina slurry (1.0, 0.3, and 0.05 µm) on microcloth pads. |
Procedure
Part A: Electrode Preparation and System Validation
- Electrode Polishing: On a clean microcloth pad, polish the glassy carbon working electrode sequentially with 1.0 µm, 0.3 µm, and 0.05 µm alumina slurry/water suspensions. Rinse thoroughly with deionized water after each step and sonicate for 1 minute in water to remove embedded alumina.
- Cell Assembly: Fill the electrochemical cell with a known redox standard solution (e.g., 5.0 mM K₃[Fe(CN)₆] in 1.0 M KCl). Assemble the three-electrode system.
- Standard CV: Purge the solution with N₂ for 10 minutes. Record cyclic voltammograms at multiple scan rates (e.g., 25, 50, 100, 200, 400 mV/s) within a suitable window (e.g., 0.0 to +0.6 V vs. Ag/AgCl).
- Area Verification: Plot the anodic peak current (ipa) vs. the square root of scan rate (v1/2). The plot should be linear. Using the known D for [Fe(CN)₆]³⁻ (7.6×10⁻⁶ cm²/s), n=1, and the slope of the line, back-calculate the effective electrode area (A). This value must be used in all subsequent calculations.
Part B: Analyte Measurement and Data Analysis
- Analyte Solution Preparation: Prepare a series of analyte solutions in the supporting electrolyte (e.g., 0.5, 1.0, 2.0 mM acetaminophen in 0.1 M PBS, pH 7.4). Purge each with N₂ for 10 minutes prior to measurement.
- CV Data Collection: For each concentration, record CVs at the same series of scan rates used in Part A. Ensure the potential window encompasses all redox events.
- Peak Current Extraction: For each voltammogram, measure the absolute anodic peak current (ipa). Correct for any capacitive background current by extrapolating the baseline before the peak.
- Randles-Ševčík Plotting & Calculation:
- For a single concentration, plot ipa vs. v1/2. Perform a linear regression. The slope (m) contains D: m = (2.69×10⁵) n3/2 A C D1/2.
- Rearrange to solve for D: D = [ m / ( (2.69×10⁵) n3/2 A C ) ]².
- Best Practice: Repeat this across multiple concentrations. The calculated D values should be consistent and independent of concentration, confirming a diffusion-controlled process. Report the mean ± standard deviation.
Diagram: Randles-Ševčík Analysis Workflow
Title: Workflow for Diffusion Coefficient Calculation via CV
Diagram: Conceptual Relationship: Parameters to Peak Current
Title: Input Parameters for Peak Current Prediction
Derivation and Mathematical Form of the Randles-Ševčík Equation
Within the broader thesis on the application of the Randles-Ševčík equation for diffusion coefficient calculation research, this document details the fundamental derivation and mathematical form of the equation. Cyclic voltammetry (CV) is a pivotal technique in electroanalytical chemistry, particularly in drug development for characterizing redox-active species. The Randles-Ševčík equation quantitatively describes the peak current in a cyclic voltammogram under diffusion-controlled conditions, providing a direct pathway to calculate the diffusion coefficient ((D)), a critical parameter in understanding molecular mobility and reaction kinetics.
Foundational Assumptions and Derivation
The derivation of the Randles-Ševčík equation for a reversible, diffusion-controlled electrode reaction begins with solving Fick's second law of diffusion under specific boundary conditions. The core assumptions are:
- The electron transfer is electrochemically reversible (Nernstian).
- Mass transport is by planar diffusion only (no convection or migration).
- The electroactive species is initially present only in the bulk solution.
- The electrode reaction is of the form ( O + ne^- \rightleftharpoons R ).
- The experiment uses a linear potential sweep: ( E = Ei - \nu t ), where (Ei) is the initial potential and (\nu) is the scan rate (V/s).
The solution involves applying the Laplace transform to Fick's second law. The concentration gradient at the electrode surface ((x=0)) is obtained, which is proportional to the faradaic current via: [ i = nFADO \left( \frac{\partial CO(x,t)}{\partial x} \right){x=0} ] where (i) is current, (n) is number of electrons, (F) is Faraday's constant, (A) is electrode area, and (DO) is the diffusion coefficient of species O.
For a reversible system, the surface concentrations are related by the Nernst equation. Solving the integral equation leads to the expression for the peak current ((ip)). The final, well-known form of the Randles-Ševčík equation at 25°C (298 K) is: [ ip = (2.69 \times 10^5) \, n^{3/2} A \, D^{1/2} \, C \, \nu^{1/2} ] where (i_p) is the peak current (A), (A) is the electrode area (cm²), (D) is the diffusion coefficient (cm²/s), (C) is the bulk concentration (mol/cm³), and (\nu) is the scan rate (V/s).
The general form at any temperature is: [ i_p = \left( \frac{nF}{RT} \right)^{1/2} ( \pi D \nu )^{1/2} n F A C ]
Logical flow for deriving the Randles-Ševčík equation.
Table 1: Key Constants and Variables in the Randles-Ševčík Equation
| Symbol | Quantity | Typical Units (Electrochemistry) | Notes |
|---|---|---|---|
| (i_p) | Peak Current | Amperes (A) | Measured from the CV baseline. |
| (n) | Number of Electrons | Dimensionless | Usually 1 or 2 for organic molecules/drug candidates. |
| (A) | Electrode Area | cm² | Geometric or electrochemically active area. |
| (D) | Diffusion Coefficient | cm²/s | Target parameter for calculation. ~10⁻⁶ cm²/s for typical species in aqueous solution. |
| (C) | Bulk Concentration | mol/cm³ | Often converted from mol/L (M): 1 mM = 1 × 10⁻⁶ mol/cm³. |
| (\nu) | Scan Rate | V/s | Typical range: 0.01 – 1 V/s for diagnostic tests. |
| (F) | Faraday Constant | 96485 C/mol | Physical constant. |
| (R) | Gas Constant | 8.314 J/(mol·K) | Physical constant. |
| (T) | Temperature | Kelvin (K) | 298 K for the common 25°C pre-factor. |
| (2.69×10^5) | Combined Constant | C mol⁻¹ V⁻¹/² | Pre-factor at 25°C: ((2.69×10^5) = (F/RT)^{1/2} * F * (π)^{1/2}). |
Table 2: Diagnostic Criteria for Reversible Systems Using Randles-Ševčík
| Parameter | Expected Behavior for Reversible System | Rationale | ||
|---|---|---|---|---|
| (i_p) vs. (\nu^{1/2}) | Linear plot passing through origin. | Direct consequence of the equation (i_p \propto \nu^{1/2}). | ||
| Peak Potential ((E_p)) | Independent of scan rate. | (\Delta Ep = E{p,a} - E_{p,c} \approx \frac{59}{n}) mV at 25°C. | ||
| ( | i{p,c}/i{p,a} | ) | Ratio ≈ 1. | Equal and opposite charges for oxidation/reduction peaks. |
Experimental Protocol for Diffusion Coefficient Determination
Protocol: Determining Diffusion Coefficient (D) of a Drug Candidate via Cyclic Voltammetry
Objective: To apply the Randles-Ševčík equation to calculate the diffusion coefficient of a redox-active pharmaceutical compound in aqueous buffer.
I. Materials and Reagent Solutions
The Scientist's Toolkit: Key Research Reagent Solutions
| Item | Function/Brief Explanation |
|---|---|
| Potentiostat/Galvanostat | Instrument to apply potential and measure current. Essential for performing CV. |
| Three-Electrode Cell | Consists of Working (e.g., glassy carbon), Reference (e.g., Ag/AgCl), and Counter (e.g., Pt wire) electrodes. |
| Supporting Electrolyte | (e.g., 0.1 M Phosphate Buffer Saline, pH 7.4). Carries current and eliminates migration; establishes ionic strength and pH relevant to physiology. |
| Analyte Stock Solution | Purified drug candidate dissolved in appropriate solvent (e.g., DMSO). Must know precise concentration. |
| Redox Standard | (e.g., 1 mM Potassium Ferricyanide in 1 M KCl). Used for electrode area calibration and system validation. |
| Degassing System | (e.g., Argon or Nitrogen gas sparge). Removes dissolved oxygen, an interfering redox agent. |
II. Methodology
Electrode Preparation:
- Polish the glassy carbon working electrode sequentially with 1.0, 0.3, and 0.05 µm alumina slurry on a microcloth. Rinse thoroughly with deionized water and sonicate for 1 minute in water, then ethanol.
- Rinse all electrodes with copious deionized water.
Electrode Area Calibration (Optional but Recommended):
- Fill cell with a standard solution (e.g., 1.0 mM K₃[Fe(CN)₆] in 1.0 M KCl).
- Record CVs at multiple scan rates (e.g., 25, 50, 100 mV/s).
- Plot anodic peak current ((i_{p,a})) vs. square root of scan rate ((\nu^{1/2})). Perform linear regression.
- Using the known (D) for ferricyanide (~7.6 × 10⁻⁶ cm²/s at 25°C), (n=1), and (C), solve the Randles-Ševčík equation for the effective electrode area ((A)).
Analyte Measurement:
- Fill the electrochemical cell with a known volume of degassed supporting electrolyte.
- Perform a background CV (e.g., -0.2 to +0.6 V vs. Ag/AgCl at 50 mV/s) to ensure a clean electrochemical window.
- Spike in a known volume of the analyte stock solution to achieve the desired final concentration (e.g., 100 µM). Mix thoroughly. Degas again for 5 minutes.
- Record CVs over a relevant potential window at a series of increasing scan rates (e.g., 10, 25, 50, 100, 200, 400 mV/s). Ensure the reversibility criteria (Table 2) are met.
Data Analysis for D Calculation:
- For each scan rate, measure the absolute peak current ((i_p)) for the oxidation or reduction wave.
- Plot (i_p) vs. (\nu^{1/2}).
- Perform linear regression on the data. The slope ((m)) of this line is given by: [ m = (2.69 \times 10^5) \, n^{3/2} A \, D^{1/2} \, C \quad \text{(at 25°C)} ]
- Rearrange to solve for the diffusion coefficient (D): [ D = \left( \frac{m}{(2.69 \times 10^5) \, n^{3/2} A \, C} \right)^2 ] Insert the slope ((m)), the known/calibrated electrode area ((A)), the number of electrons ((n)), and the bulk concentration ((C)).
CV workflow for determining the diffusion coefficient.
Key Assumptions and Ideal Conditions for Valid Application
1. Introduction The Randles-Ševčík equation is fundamental in electrochemistry for determining the diffusion coefficient (D) of electroactive species from cyclic voltammetry (CV) data. Its valid application is a cornerstone of the broader thesis research, which seeks to establish robust, standardized protocols for D calculation in pharmaceutical analyte characterization. This document details the critical assumptions, ideal conditions, and experimental validation protocols required for reliable results.
2. Key Theoretical Assumptions The derivation of the Randles-Ševčík equation for a reversible, diffusion-controlled system rests on these non-negotiable assumptions:
- Reversible Electron Transfer: The electrochemical reaction is Nernstian (fast kinetics). The standard electrochemical rate constant (k⁰) must be sufficiently high.
- Semi-Infinite Linear Diffusion: Mass transport is solely via planar diffusion to a flat electrode surface. Convection and migration effects are absent.
- Electrode as a Perfectly Smooth Plane: The electrode surface is uniformly accessible and does not induce edge effects or spherical diffusion.
- Single, Irreversible Step: The reaction involves a simple, one-step electron transfer without coupled chemical reactions.
- Solution Contains Excess Supporting Electrolyte: Typically ≥100:1 ratio of inert electrolyte to analyte to eliminate migratory mass transport.
- Constant Diffusion Coefficient: D is independent of concentration and potential.
- Temperature Control: The system is isothermal to maintain constant D.
3. Ideal Experimental Conditions To satisfy the theoretical assumptions, the following experimental conditions must be meticulously established.
Table 1: Ideal Experimental Parameters for Randles-Ševčík Application
| Parameter | Ideal Condition | Rationale & Consequence of Deviation |
|---|---|---|
| Electrode | Static, planar disk (e.g., Pt, GC, Au); mirror-polished. | Ensures planar diffusion. Rough surfaces increase apparent area, overestimating D. |
| Cell Geometry | Standard 3-electrode cell with proper placement. | Minimizes uncompensated resistance and ensures uniform current distribution. |
| Supporting Electrolyte | High concentration (≥0.1 M), inert, high purity. | Eliminates migration, defines ionic strength. Impurities can cause side reactions. |
| Analyte Concentration | Typically 1-5 mM for redox probe. | Optimal signal-to-noise. High conc. may induce convection; low conc. increases error. |
| Solution Degassing | Thorough nitrogen/argon sparging (≥15 min). | Removes dissolved O₂, which can interfere via reduction/oxidation reactions. |
| Temperature | Controlled and recorded (e.g., 25.0 ± 0.1 °C). | D is temperature-dependent. Uncontrolled temp leads to erroneous, non-reproducible D. |
| Quiescent Solution | No stirring during CV scan. | Prevents convective mass transport, preserving diffusion-only condition. |
| Potential Window | Sufficiently wide around formal potential (E⁰'). | Ensures full achievement of limiting current at scan extremes. |
| Scan Rate Range | Typically 0.01 - 1 V/s for macroelectrodes. | Too fast: non-reversible behavior, capacitive current interference. Too slow: drift, convection. |
4. Experimental Validation Protocols Before applying the Randles-Ševčík equation, the system's adherence to assumptions must be validated.
Protocol 4.1: Verification of Reversibility (Nernstian Behavior)
- Objective: Confirm the electron transfer is fast (reversible).
- Methodology:
- Record CVs of the redox probe (e.g., 1 mM K₃Fe(CN)₆ in 1 M KCl) at multiple scan rates (ν).
- Measure the peak potential separation (ΔEₚ) between anodic and cathodic peaks.
- Success Criteria: ΔEₚ is ~59/n mV (e.g., 59 mV for n=1) and independent of scan rate at 25°C.
- Failure Indication: ΔEₚ > 59/n mV and increases with ν, indicating quasi-reversible or irreversible kinetics. The Randles-Ševčík equation is invalid.
Protocol 4.2: Verification of Diffusion Control
- Objective: Confirm mass transport is solely by diffusion.
- Methodology:
- Plot peak current (iₚ) vs. square root of scan rate (ν^(1/2)) for the validated reversible system.
- Perform linear regression analysis on the iₚ vs. ν^(1/2) plot.
- Success Criteria: A linear plot passing through the origin (R² > 0.998). This confirms iₚ ∝ ν^(1/2), the signature of diffusion control.
- Failure Indication: Non-linear plot or significant positive intercept. Suggests contributions from adsorbed species (intercept) or mixed control.
Protocol 4.3: Determination of Electrode Area
- Objective: Accurately determine the electroactive area (A) for the D calculation.
- Methodology: Use the same reversible redox probe with a known diffusion coefficient (e.g., D for K₃Fe(CN)₆ is 7.6 × 10⁻⁶ cm²/s in 1 M KCl at 25°C).
- Perform CV at a single, moderate scan rate (e.g., 0.1 V/s).
- Measure the cathodic or anodic peak current (iₚ).
- Rearrange the Randles-Ševčík equation to solve for A: A = iₚ / (2.69×10⁵ * n^(3/2) * D^(1/2) * C * ν^(1/2)).
- Note: This measured A must be used in subsequent D calculations for unknown analytes on the same electrode setup.
5. The Scientist's Toolkit: Research Reagent Solutions Table 2: Essential Materials for Valid Randles-Ševčík Experiments
| Item | Function & Critical Specification |
|---|---|
| Polishing Kit | Alumina or diamond suspensions (1.0, 0.3, 0.05 µm) on flat pads. Creates a mirror-smooth, reproducible electrode surface for planar diffusion. |
| Redox Probes | Potassium ferricyanide (K₃[Fe(CN)₆]) and/or ferrocenemethanol. Well-characterized, reversible standards for system validation and area calibration. |
| High-Purity Supporting Electrolytes | KCl, KNO₃, TBAPF₆, etc. (≥99.9%). Provides ionic strength, suppresses migration. Must be electrochemically inert in the potential window. |
| Inert Gas Supply | Ultra-high-purity N₂ or Ar gas with O₂ scrubbing line. For deaerating solutions to remove interfering oxygen. |
| Potentiostat with IR Compensation | Modern potentiostat with positive feedback or current interrupt iR compensation. Minimizes distortion from solution resistance, critical for accurate ΔEₚ. |
| Thermostatted Electrochemical Cell | Cell with water jacket connected to a circulating bath (±0.1 °C). Maintains constant temperature for reproducible D measurement. |
| Nanopure Water | High-resistance water (≥18.2 MΩ·cm). Prevents contamination from ions/organics that affect baseline or reaction. |
6. Visual Workflows
Title: System Validation & D Calculation Workflow
Title: Core Assumptions & Validation Checks Map
This application note is framed within a broader thesis research project focused on the precise application of the Randles-Sevcik equation for calculating the diffusion coefficient (D) of electroactive species. The diffusion coefficient is a fundamental kinetic parameter that quantifies the rate of mass transport of an analyte (e.g., a drug molecule, a redox probe) through a solution to an electrode surface under a concentration gradient. Its accurate determination is critical for understanding reaction mechanisms, optimizing sensor performance, and predicting the behavior of species in electrochemical drug screening and development.
Physical Significance of the Diffusion Coefficient
In electrochemical systems, the diffusion coefficient (D, units: cm² s⁻¹) dictates how rapidly an electroactive species can reach the electrode to undergo redox reactions. Its value is influenced by:
- Solute Properties: Size, shape, and charge of the molecule.
- Solvent Properties: Viscosity and temperature.
- Solution Environment: Ionic strength and molecular interactions. A higher D signifies faster mass transport, leading to higher currents. In drug development, variations in D can indicate binding events, changes in molecular conformation, or aggregation states.
Key Experimental Protocol: Cyclic Voltammetry forDDetermination via Randles-Sevcik Equation
The primary method for determining D is Cyclic Voltammetry (CV) using the Randles-Sevcik equation for a reversible, diffusion-controlled system.
Randles-Sevcik Equation (at 25°C): ( I_p = (2.69 \times 10^5) \cdot n^{3/2} \cdot A \cdot D^{1/2} \cdot C \cdot \nu^{1/2} ) Where:
- ( I_p ) = Peak current (Amperes)
- ( n ) = Number of electrons transferred
- ( A ) = Electrode area (cm²)
- ( D ) = Diffusion coefficient (cm² s⁻¹)
- ( C ) = Bulk concentration (mol cm⁻³)
- ( \nu ) = Scan rate (V s⁻¹)
Detailed Protocol:
- Solution Preparation: Prepare a degassed solution containing a known, low concentration (e.g., 1-5 mM) of the redox-active analyte (e.g., potassium ferricyanide, K₃[Fe(CN)₆]) in a supporting electrolyte (e.g., 1.0 M KCl).
- Electrode Preparation: Polish the working electrode (e.g., glassy carbon) successively with finer alumina slurries (1.0, 0.3, and 0.05 µm) on a microcloth. Rinse thoroughly with deionized water and sonicate if necessary.
- Electrochemical Cell Setup: Assemble a standard three-electrode cell with the polished working electrode, a Pt wire counter electrode, and a suitable reference electrode (e.g., Ag/AgCl (3 M KCl)).
- Cyclic Voltammetry Data Acquisition: Record cyclic voltammograms at a series of scan rates (e.g., 10, 25, 50, 75, 100, 150, 200 mV/s) over a suitable potential window encompassing the redox couple.
- Data Analysis: For each scan rate, measure the absolute peak current (( Ip )) for the oxidation or reduction wave. Plot ( Ip ) vs. ( \nu^{1/2} ). The plot should be linear for a diffusion-controlled process.
- Calculation of D: Determine the slope of the ( I_p ) vs. ( \nu^{1/2} ) plot. Using the known values of n, A, and C, solve the Randles-Sevcik equation for D.
Table 1: Typical Experimental Data for Potassium Ferricyanide (1 mM in 1.0 M KCl) at a 3 mm Diameter Glassy Carbon Electrode (A = 0.0707 cm², n=1).
| Scan Rate, ν (mV/s) | √ν ( (V/s)^1/2 ) | Cathodic Peak Current, Ip (µA) | Calculated D (cm²/s)* |
|---|---|---|---|
| 10 | 0.100 | 15.2 | 7.25 x 10⁻⁶ |
| 25 | 0.158 | 23.8 | 7.18 x 10⁻⁶ |
| 50 | 0.224 | 33.9 | 7.22 x 10⁻⁶ |
| 75 | 0.274 | 41.5 | 7.20 x 10⁻⁶ |
| 100 | 0.316 | 47.8 | 7.21 x 10⁻⁶ |
| 150 | 0.387 | 58.6 | 7.19 x 10⁻⁶ |
| 200 | 0.447 | 67.6 | 7.23 x 10⁻⁶ |
Average D ± Std Dev: ( (7.21 \pm 0.02) \times 10^{-6} ) cm²/s
*D calculated from individual (Ip, √ν) data point using the rearranged Randles-Sevcik equation.
Table 2: Literature Diffusion Coefficients for Common Redox Probes at 25°C.
| Compound | Solvent/Electrolyte | Diffusion Coefficient, D (cm²/s) |
|---|---|---|
| Ferrocene | Acetonitrile / 0.1 M TBAPF₆ | ~2.4 x 10⁻⁵ |
| Potassium Ferricyanide | Water / 1.0 M KCl | ~7.2 x 10⁻⁶ |
| Ru(NH₃)₆³⁺ | Water / 0.1 M KCl | ~8.6 x 10⁻⁶ |
| Dopamine | PBS Buffer (pH 7.4) | ~6.7 x 10⁻⁶ |
The Scientist's Toolkit: Key Research Reagent Solutions
Table 3: Essential Materials for Diffusion Coefficient Determination.
| Item | Function & Specification |
|---|---|
| Potassium Ferricyanide (K₃[Fe(CN)₆]) | Standard redox probe for method validation. Provides a reversible, one-electron transfer (Fe³⁺/²⁺). |
| Supporting Electrolyte (e.g., KCl, TBAPF₆) | Suppresses migration current by providing excess inert ions, ensuring mass transport is purely diffusional. |
| Glassy Carbon Working Electrode | Standard inert electrode with a well-defined, polishable surface for area calculation. |
| Alumina Polishing Slurries (1.0, 0.3, 0.05 µm) | For achieving a mirror-finish, reproducible electrode surface, which is critical for accurate area (A). |
| Potentiostat/Galvanostat | Instrument to apply controlled potential and measure resulting current with high precision. |
| Degassing System (Argon/N₂ Gas) | Removes dissolved oxygen, which can interfere with the redox reaction of the analyte. |
Visualization of Concepts and Workflow
Title: Experimental Workflow for Determining D via Randles-Sevcik
Title: Physical Basis of Diffusion-Limited Current
This application note provides detailed protocols and analysis for the precise determination of the diffusion coefficient (D) using the Randles-Ševčík equation in the context of electrochemical analysis, crucial for drug development and materials science research. The accurate quantification of D hinges on the rigorous control and measurement of critical interdependent parameters: the number of electrons transferred (n), electrode area (A), bulk concentration (C), scan rate (v), and temperature. This work is framed within a broader thesis investigating the optimization and validation of this fundamental electrochemical relationship.
The Randles-Ševčík Equation and Its Parameters
For a reversible, diffusion-controlled redox process at a planar electrode, the Randles-Ševčík equation describes the relationship between the peak current (I_p) and the critical experimental variables at 298 K:
I_p = (2.69 × 10^5) * n^(3/2) * A * D^(1/2) * C * v^(1/2)
Where:
- I_p = Peak current (A)
- n = Number of electrons transferred in the redox event
- A = Electrode geometric area (cm²)
- D = Diffusion coefficient (cm²/s)
- C = Bulk concentration of the electroactive species (mol/cm³)
- v = Scan rate (V/s)
Temperature (T) affects the equation via the diffusion coefficient, which follows an Arrhenius-type relationship, and through its inclusion in the fundamental constant when deviating from 298 K. The full constant is (2.69 × 10^5) * T^(1/2).
The interdependency of these parameters necessitates a systematic experimental approach to isolate and validate each variable for accurate D calculation.
| Parameter | Symbol | Typical Units | Role in Equation | Key Validation/Calibration Method |
|---|---|---|---|---|
| Number of Electrons | n | Dimensionless | Direct proportionality to I_p; n^(3/2) dependence | Cyclic voltammetry with known standards (e.g., Ferrocene); coulometry. |
| Electrode Area | A | cm² | Direct proportionality to I_p. | Chronoamperometry with a known redox couple (e.g., 1 mM K₃Fe(CN)₆ in 1 M KCl). |
| Bulk Concentration | C | mol/cm³ | Direct proportionality to I_p. | Accurate gravimetric/volumetric preparation; UV-Vis spectrophotometry calibration. |
| Diffusion Coefficient | D | cm²/s | Square root dependence on I_p (D^(1/2)). | Calculated output via slope of I_p vs. v^(1/2) plot after A, n, C are validated. |
| Scan Rate | v | V/s | Square root dependence on I_p (v^(1/2)). | Potentiostat calibration; use verified range (e.g., 0.01 - 1 V/s for planar electrodes). |
| Temperature | T | K | Affects D and the pre-constant. | Use thermostated cell; report controlled temperature ± 0.5 K. |
Experimental Protocols
Protocol 1: Electrode Area (A) Calibration via Chronoamperometry
Objective: To determine the effective electroactive area of a working electrode (e.g., glassy carbon, platinum) using a reference redox system with a known D. Principle: The Cottrell equation governs current decay in chronoamperometry: I(t) = (nFA C D^(1/2))/(π^(1/2) t^(1/2)). Materials: See "The Scientist's Toolkit" below. Procedure:
- Polish the working electrode sequentially with 1.0, 0.3, and 0.05 μm alumina slurry on a microcloth. Sonicate in distilled water and ethanol for 2 minutes each.
- Prepare a 1.0 mM solution of potassium ferricyanide (K₃Fe(CN)₆) in 1.0 M potassium chloride (KCl) supporting electrolyte. Deoxygenate with argon or nitrogen for 10 minutes.
- Setup a standard three-electrode cell. Apply a potential step from open circuit potential (OCP) to a value 200 mV beyond the known reduction potential of Fe(CN)₆³⁻ (e.g., step to +0.2 V vs. Ag/AgCl for reduction).
- Record the current transient for 5-10 seconds. Repeat in triplicate.
- Plot I(t) vs. t^(-1/2). The slope is equal to (nFA C D^(1/2))/(π^(1/2)).
- Using the known n=1, C (1.0 × 10⁻⁶ mol/cm³), and D for Fe(CN)₆³⁻ (7.6 × 10⁻⁶ cm²/s at 298 K), calculate the effective electrode area A from the slope.
Protocol 2: Determination ofnand System Reversibility
Objective: To confirm the number of electrons transferred and the reversibility of the redox couple under study. Principle: For a reversible system, ΔEp (separation between anodic and cathodic peak potentials) ≈ 59/n mV at 298 K, and Ipa/I_pc ≈ 1. Procedure:
- Using the calibrated electrode from Protocol 1, obtain a cyclic voltammogram of your analyte at a slow scan rate (e.g., 0.05 V/s).
- Measure the anodic (Epa) and cathodic (Epc) peak potentials. Calculate ΔE_p.
- If ΔE_p is close to 59/n mV, the process is electrochemically reversible. Use this relationship to estimate n.
- For definitive n, use bulk electrolysis (coulometry) or compare with a standard of known n under identical conditions.
Protocol 3: Diffusion Coefficient (D) Calculation via Variable Scan Rate CV
Objective: To accurately calculate the diffusion coefficient of the target analyte. Principle: The Randles-Ševčík equation predicts a linear relationship between I_p and the square root of scan rate (v^(1/2)) for a diffusion-controlled process. Procedure:
- Prepare a deoxygenated solution of the analyte with a precisely known concentration (C) in appropriate supporting electrolyte.
- Using the calibrated electrode (known A), record cyclic voltammograms at a minimum of 6 different scan rates (e.g., 0.02, 0.05, 0.1, 0.2, 0.5, 0.75 V/s). Ensure no signs of adsorption (I_p/v is constant) or kinetic limitations.
- For each voltammogram, record the absolute peak current (I_p) for either the forward or reverse scan.
- Plot I_p vs. v^(1/2). Perform linear regression. The slope (m) = (2.69 × 10^5) * n^(3/2) * A * D^(1/2) * C.
- Solve for D: D = [ m / ((2.69 × 10^5) * n^(3/2) * A * C) ]².
- Report D with standard error derived from the linear regression.
Protocol 4: Investigating Temperature Dependence ofD
Objective: To determine the activation energy for diffusion. Principle: The diffusion coefficient follows D = D₀ exp(-E_a/RT). Procedure:
- Place the electrochemical cell in a thermostated jacket connected to a circulator.
- Measure D using Protocol 3 at a minimum of 4 different temperatures (e.g., 288, 298, 308, 318 K).
- Plot ln(D) vs. 1/T (Arrhenius plot). The slope of the resulting line is -E_a/R.
- Calculate the activation energy (E_a) for the diffusion process.
Visualizations
Title: Workflow for D Determination from Critical Parameters
Title: Variable Relationships in the Randles-Sevcik Equation
The Scientist's Toolkit
Table 2: Essential Research Reagent Solutions and Materials
| Item | Function in Experiment | Specification / Notes |
|---|---|---|
| Potentiostat/Galvanostat | Applies potential/current and measures electrochemical response. | Must have accurate scan rate and current measurement calibration. |
| Three-Electrode Cell | Contains working, counter, and reference electrodes. | Glass body, with ports for electrodes and gas bubbling. |
| Glassy Carbon Working Electrode | Primary working electrode for many analytes. | 3 mm diameter common; requires polishing before use. |
| Ag/AgCl Reference Electrode | Provides stable, known reference potential. | Stored in appropriate filling solution (e.g., 3 M KCl). |
| Platinum Wire Counter Electrode | Completes the electrical circuit. | High surface area; cleaned via flaming or electrochemical cycling. |
| Alumina Polishing Suspension | For renewing the electrode surface. | 1.0, 0.3, and 0.05 μm particle sizes for sequential polishing. |
| Potassium Ferricyanide (K₃Fe(CN)₆) | Redox standard for area calibration and reversibility check. | Known D (7.6 × 10⁻⁶ cm²/s in 1 M KCl at 298 K), n=1. |
| Potassium Chloride (KCl) | Inert supporting electrolyte. | High purity (>99.9%) to minimize Faradaic interference. |
| Inert Gas (Ar/N₂) | Removes dissolved oxygen. | Oxygen can participate in unwanted side redox reactions. |
| Thermostatic Circulator | Controls solution temperature for T-dependence studies. | Accuracy of ±0.5 K is recommended. |
Step-by-Step Protocol: Applying the Randles-Ševčík Equation in Practice
This document details the critical experimental procedures for preparing working electrodes and formulating electrochemical solutions, as applied within a thesis investigating the precise application of the Randles-Sevcik equation for calculating diffusion coefficients (D) of redox-active pharmaceutical compounds. The accuracy of D is paramount in drug development for predicting pharmacokinetic properties like membrane permeation. The Randles-Sevcik equation (for a reversible system: iₚ = (2.69×10⁵) n^(3/2) A C D^(1/2) v^(1/2)) is highly sensitive to experimental parameters; thus, meticulous setup is required to ensure the validity of its assumptions.
Research Reagent Solutions & Essential Materials
| Item Name | Specification/Composition | Primary Function in Experiment |
|---|---|---|
| Glassy Carbon Electrode (GCE) | 3 mm diameter, mirror finish | Standard inert working electrode substrate for a wide potential window. |
| Alumina Slurry | 0.05 µm and 0.3 µm α-Al₂O₃ particles in deionized water. | Abrasive for mechanical polishing to regenerate a pristine, planar electrode surface. |
| Electrolyte Solution (Supporting Electrolyte) | 0.1 M Potassium Chloride (KCl) or 0.1 M Tetrabutylammonium Hexafluorophosphate (TBAPF₆) in purified solvent. | Provides high ionic strength to minimize solution resistance (Ohmic drop) and eliminate migration current. |
| Redox Probe Solution | 1.0 mM Potassium Ferricyanide (K₃[Fe(CN)₆]) in 0.1 M KCl. | Standard reversible probe ([Fe(CN)₆]³⁻/⁴⁻) for validating electrode activity and calibrating the setup. |
| Analyte Solution | e.g., 0.5 mM Dopamine HCl or 0.5 mM Acetaminophen in suitable buffer/electrolyte. | The drug molecule of interest whose diffusion coefficient is to be determined. |
| Aqueous Buffer | e.g., 0.1 M Phosphate Buffer Saline (PBS), pH 7.4. | For drug studies, maintains physiological pH and stabilizes proton-coupled redox reactions. |
| Organic Solvent | Acetonitrile (CH₃CN) or N,N-Dimethylformamide (DMF), anhydrous. | Dissolves non-aqueous soluble drug compounds and electrolytes like TBAPF₆. |
| Electrode Polishing Microcloth | Non-abrasive synthetic cloth. | Flat substrate for holding alumina slurry during polishing. |
| Ultrasonic Cleaner Bath | Deionized water or ethanol as bath medium. | Removes adsorbed alumina particles and contaminants from the electrode surface after polishing. |
Detailed Experimental Protocols
Protocol 1: Working Electrode (GCE) Preparation and Polishing
Objective: To achieve a atomically smooth, clean, and reproducible electrode surface.
- Initial Rough Polishing: Place a small amount of 0.3 µm alumina slurry on a clean, wet microcloth mounted on a flat surface. Polish the GCE surface using firm, figure-8 patterns for 60 seconds.
- Rinse: Rinse the electrode thoroughly with a stream of deionized water to remove all larger alumina particles.
- Fine Polishing: Repeat Step 1 using the 0.05 µm alumina slurry for 90 seconds to create a mirror finish.
- Ultrasonic Cleaning: Submerge the rinsed electrode in an ultrasonic bath filled with deionized water. Sonicate for 60 seconds to dislodge any adhered particles.
- Final Rinse & Dry: Rinse again with deionized water and dry gently with a lint-free tissue or under a nitrogen stream.
- Electrochemical Activation (Optional): Prior to use, cycle the polished GCE in a clean supporting electrolyte (e.g., 0.1 M KCl) between -0.2 V and +0.6 V (vs. Ag/AgCl) at 100 mV/s for 20-30 cycles until a stable background is obtained.
Protocol 2: Solution Preparation and Deaeration
Objective: To prepare oxygen-free, contamination-free electrochemical solutions.
- Electrolyte Preparation: Weigh the high-purity supporting electrolyte salt (e.g., KCl) and dissolve it in the appropriate solvent (H₂O, buffer, or organic solvent) to achieve the desired molarity (typically 0.1 M). Use volumetric flasks for accuracy.
- Analyte/Probe Solution Preparation: Prepare a concentrated stock solution of the redox probe or drug analyte. Sparingly add aliquots of this stock to the electrolyte solution to achieve the final concentration (typically 0.1 - 5 mM). Mix thoroughly.
- Solution Deaeration: For non-aqueous studies or when oxygen interferes with the redox couple, bubble the solution with an inert gas (Argon or Nitrogen) for a minimum of 15 minutes prior to measurement. Maintain a gentle gas blanket over the solution during experiments to prevent oxygen re-entry.
Protocol 3: Experimental Validation Using a Standard Redox Probe
Objective: To verify the quality of the electrode preparation and the overall setup before testing unknown analytes.
- Assemble the three-electrode cell with the polished GCE as the working electrode, a Pt wire as the counter electrode, and a Ag/AgCl (sat. KCl) reference electrode.
- Fill the cell with the prepared 1.0 mM K₃[Fe(CN)₆] in 0.1 M KCl solution.
- Record cyclic voltammograms (CVs) at a moderate scan rate (e.g., 50 mV/s). A well-prepared system will show a reversible wave with a peak separation (ΔEp) close to 59 mV/n (≈59 mV for a one-electron transfer) and symmetrical peaks.
- Data for Randles-Sevcik Validation: Record CVs at a series of increasing scan rates (e.g., 10, 25, 50, 75, 100, 200, 400 mV/s). The plot of anodic peak current (iₚₐ) vs. the square root of scan rate (v^(1/2)) should be linear and pass through the origin, confirming diffusion-controlled kinetics.
Table 1: Key Parameters for Randles-Sevcik Analysis from Standard Probe
| Parameter | Symbol | Value for 1 mM [Fe(CN)₆]³⁻ in 0.1 M KCl | Notes |
|---|---|---|---|
| Number of Electrons | n | 1 | Known for standard probe. |
| Electrode Area | A | ~0.0707 cm² (for 3 mm dia.) | Must be calibrated experimentally. |
| Bulk Concentration | C | 1.0 × 10⁻⁶ mol/cm³ | Convert from 1.0 mM. |
| Scan Rate Range | v | 0.01 – 0.5 V/s | Must ensure ΔEp < 80 mV for reversibility. |
| Expected Peak Sep. | ΔEp | 59 – 70 mV | Indicator of system reversibility/Nernstian behavior. |
| Target R² for iₚ vs. v^(1/2) | R² | >0.995 | Confirms diffusion control for valid D calculation. |
Table 2: Impact of Common Setup Errors on Randles-Sevcik Output
| Setup Error | Effect on CV | Effect on iₚ vs. v^(1/2) Plot | Consequence for Calculated D |
|---|---|---|---|
| Unpolished/Dirty Electrode | Large ΔEp, low iₚ, broad peaks. | Non-linear, poor R², slope too low. | D underestimated, high error. |
| Insufficient Supporting Electrolyte | High resistance, drawn-out peaks, distorted shape. | May appear linear but slope is inconsistent. | D is unreliable and often overestimated. |
| Dissolved Oxygen (for sensitive couples) | Additional redox waves, increased background current. | Non-linearity, intercept shift. | Significant interference, invalid result. |
| Inaccurate Concentration (C) | Scale of iₚ is directly proportional. | Alters slope proportionally. | Direct proportional error in D (D ∝ slope²/C²). |
Diagrams & Workflows
Experimental Workflow for Valid D Calculation
Application Notes
Cyclic voltammetry (CV) performed at multiple scan rates is a foundational electrochemical technique for characterizing redox-active species, particularly within the context of applying the Randles-Ševčík equation to determine diffusion coefficients ((D)). This protocol is critical in pharmaceutical development for analyzing drug molecules, metabolites, and biomarkers that undergo redox processes. The linear relationship between peak current ((i_p)) and the square root of scan rate ((\nu^{1/2})) confirms diffusion-controlled kinetics, a prerequisite for valid (D) calculation. Deviations from linearity indicate complications like adsorption or coupled chemical reactions, which must be identified prior to diffusion analysis.
Experimental Protocols
Protocol 1: Electrode Preparation and System Setup
- Working Electrode Preparation: Polish glassy carbon electrode (GCE) successively with 1.0 µm, 0.3 µm, and 0.05 µm alumina slurry on a microcloth pad. Rinse thoroughly with deionized water between each polish and after final polish.
- Sonication: Sonicate the polished GCE in ethanol for 1 minute, followed by deionized water for 1 minute to remove residual alumina particles.
- Electrochemical Activation: Place the cleaned GCE in a supporting electrolyte solution (e.g., 0.1 M phosphate buffer, pH 7.4). Perform cyclic voltammetry from -0.2 V to +0.6 V vs. Ag/AgCl at 100 mV/s for 20-30 cycles until a stable background is achieved.
- Cell Assembly: Assemble a standard three-electrode cell with the prepared GCE as the working electrode, a platinum wire as the counter electrode, and an Ag/AgCl (3 M KCl) reference electrode. Introduce 10 mL of degassed supporting electrolyte.
Protocol 2: Multi-Scan Rate CV Data Collection
- Background Acquisition: Record CVs of the supporting electrolyte alone at all intended scan rates (e.g., 10, 25, 50, 75, 100, 200, 400, 500 mV/s). This establishes the capacitive background current.
- Analyte Introduction: Add a precise volume of analyte stock solution to the cell to achieve a known concentration (typical range: 0.5 - 5 mM). Purge with inert gas (N₂ or Ar) for 5-10 minutes to remove oxygen.
- Voltammogram Collection: Starting from the lowest scan rate, record CVs across the full set of predetermined scan rates. Ensure the potential window encompasses both the cathodic and anodic peak potentials.
- Replication: Repeat the multi-scan rate sequence for a minimum of (n=3) independently prepared samples or electrode surfaces.
Protocol 3: Data Processing for Randles-Ševčík Analysis
- Background Subtraction: Subtract the background voltammogram for each corresponding scan rate from the analyte voltammogram.
- Peak Current Measurement: For each scan rate, measure the absolute value of the anodic peak current ((i{pa})) and cathodic peak current ((i{pc})) from the baseline-corrected CV.
- Plot Construction: Create a plot of (i_p) (y-axis) vs. (\sqrt{\nu}) (x-axis) for both anodic and cathodic peaks.
- Linearity Assessment: Perform linear regression. A linear fit with an R² value >0.995 typically indicates a diffusion-controlled process. The slope is used in the Randles-Ševčík equation.
Data Presentation
Table 1: Representative CV Peak Current Data for Ferrocenemethanol (1.0 mM in 0.1 M KCl) at a 3 mm Diameter GCE
| Scan Rate, ν (mV/s) | √ν (V/s)^(1/2) | Anodic Peak Current, i_pa (µA) | Cathodic Peak Current, i_pc (µA) | ΔE_p (mV) |
|---|---|---|---|---|
| 10 | 0.100 | 2.45 ± 0.08 | -2.38 ± 0.07 | 68 |
| 25 | 0.158 | 3.89 ± 0.12 | -3.80 ± 0.11 | 70 |
| 50 | 0.224 | 5.51 ± 0.15 | -5.42 ± 0.14 | 72 |
| 100 | 0.316 | 7.80 ± 0.21 | -7.68 ± 0.20 | 75 |
| 200 | 0.447 | 11.02 ± 0.28 | -10.91 ± 0.27 | 78 |
| 400 | 0.632 | 15.58 ± 0.40 | -15.42 ± 0.38 | 82 |
| 500 | 0.707 | 17.42 ± 0.45 | -17.25 ± 0.43 | 84 |
Table 2: Calculated Diffusion Coefficients (D) from Randles-Ševčík Analysis
| Analyte | Supporting Electrolyte | Slope from i_p vs. √ν (µA/(V/s)^(1/2)) | n (electrons) | A (cm²) | C (mol/cm³) | D (cm²/s) |
|---|---|---|---|---|---|---|
| Ferrocenemethanol | 0.1 M KCl | 24.63 | 1 | 0.0707 | 1.00E-06 | (6.73 ± 0.25)E-06 |
| Potassium Ferricyanide | 0.1 M KCl | 26.18 | 1 | 0.0707 | 1.00E-06 | (7.60 ± 0.30)E-06 |
Note: Randles-Ševčík Equation for a reversible system at 25°C: (i_p = (2.69 \times 10^5) n^{3/2} A D^{1/2} C \nu^{1/2})
Visualizations
Multi-Scan Rate CV Workflow for Randles-Sevcik Analysis
Logical Pathway from CV Data to D and Thesis Context
The Scientist's Toolkit
Table 3: Essential Research Reagent Solutions & Materials
| Item | Function in Experiment |
|---|---|
| Glassy Carbon Working Electrode (3 mm diameter) | Standard inert electrode substrate providing a reproducible surface for electron transfer. |
| Ag/AgCl Reference Electrode (3 M KCl) | Provides a stable, known reference potential against which working electrode potential is controlled. |
| Platinum Wire Counter Electrode | Completes the electrical circuit, carrying current from the potentiostat. |
| High-Purity Alumina Polishing Slurries (1.0, 0.3, 0.05 µm) | For sequential mechanical polishing of the working electrode to an atomically smooth, reproducible surface. |
| Supporting Electrolyte (e.g., 0.1 M Phosphate Buffer, KCl) | Provides ionic conductivity, controls pH, and minimizes solution resistance (iR drop). |
| Analyte Stock Solution (in solvent compatible with electrolyte) | Provides the redox-active species of interest at a precise, known concentration. |
| Inert Gas (N₂ or Ar) with Degassing Line | Removes dissolved oxygen, which can interfere with the redox chemistry of many analytes. |
| Potentiostat/Galvanostat | Instrument that applies the controlled potential waveform and measures the resulting current. |
| Faraday Cage | Encloses the electrochemical cell to shield from external electromagnetic interference (noise). |
Application Notes
The Randles-Ševčík equation is a cornerstone of electrochemical analysis, directly relating the peak current (Ip) in cyclic voltammetry to the square root of the scan rate (v^(1/2)) for a diffusion-controlled, reversible redox process. Plotting this relationship is the primary method for calculating the diffusion coefficient (D) of an electroactive species, a critical parameter in drug development for understanding molecular mobility in solution or within biological matrices. Within the broader thesis on the application of the Randles-Ševčík equation, this protocol details the precise methodology for generating the definitive Randles-Ševčík plot, validating experimental conditions, and extracting accurate diffusion coefficients.
The fundamental equation for a reversible system at 25°C is: Ip = (2.69 × 10^5) * n^(3/2) * A * D^(1/2) * C * v^(1/2) Where: Ip = peak current (A) n = number of electrons transferred A = electrode area (cm²) D = diffusion coefficient (cm²/s) C = bulk concentration (mol/cm³) v = scan rate (V/s)
A linear plot of Ip vs. v^(1/2) confirms a diffusion-controlled process. The slope of this line is used to calculate D, provided other parameters are known.
Key Data Tables
Table 1: Typical Cyclic Voltammetry Data for Ferrocene Carboxylic Acid (1.0 mM in 0.1 M KCl) at a 3 mm Diameter Glassy Carbon Electrode
| Scan Rate (mV/s) | √Scan Rate ((V/s)^(1/2)) | Anodic Peak Current, Ip (µA) |
|---|---|---|
| 50 | 0.224 | 15.2 |
| 100 | 0.316 | 21.5 |
| 200 | 0.447 | 30.4 |
| 400 | 0.632 | 43.1 |
| 600 | 0.775 | 52.8 |
| 800 | 0.894 | 61.0 |
Table 2: Calculated Diffusion Coefficients for Model Compounds (25°C)
| Compound | Solvent/Electrolyte | Electrode | D (cm²/s) × 10^-6 | Reference Method |
|---|---|---|---|---|
| Ferrocene | Acetonitrile / 0.1 M TBAPF6 | Pt disk (2 mm) | 2.24 ± 0.05 | Randles-Ševčík |
| Potassium Ferricyanide | Water / 1.0 M KCl | Au disk (1.6 mm) | 7.26 ± 0.12 | Randles-Ševčík |
| Dopamine | PBS (pH 7.4) | CFE | 6.70 ± 0.15 | Randles-Ševčík |
| Ru(NH₃)₆³⁺ | Water / 0.1 M KCl | GC disk (3 mm) | 8.70 ± 0.10 | Chronoamperometry |
Experimental Protocols
Protocol 1: Electrode Preparation and Characterization
Objective: To ensure a clean, reproducible, and geometrically defined electrode surface for accurate area (A) determination.
- Polishing: Polish glassy carbon or metal disk electrode sequentially with 1.0 µm, 0.3 µm, and 0.05 µm alumina slurry on a microcloth pad. Use a figure-8 pattern for 30-60 seconds per grade.
- Sonication: Rinse thoroughly with deionized water and sonicate in water for 1 minute to remove adhered alumina particles.
- Electrochemical Activation: In 0.5 M H₂SO₄, perform cyclic voltammetry from -0.2 V to +1.5 V (vs. Ag/AgCl) at 100 mV/s for 20-50 cycles until a stable voltammogram is achieved.
- Area Calibration (Potassium Ferricyanide): Record CVs at multiple scan rates (e.g., 10-100 mV/s) in a solution of 1-5 mM K₃Fe(CN)₆ in 1.0 M KCl. Plot Ip vs. v^(1/2) and use the known D for Fe(CN)₆³⁻ (7.6 × 10⁻⁶ cm²/s at 25°C) to back-calculate the effective electrode area (A).
Protocol 2: Randles-Ševčík Plot Generation for Diffusion Coefficient Determination
Objective: To obtain a valid Randles-Ševčík plot and calculate the diffusion coefficient of a target analyte.
- Solution Preparation: Prepare a degassed solution containing the electroactive species (e.g., 1.0 mM drug candidate) in a suitable supporting electrolyte (e.g., PBS for pharmaceuticals).
- Initial Scan: Record a cyclic voltammogram at a moderate scan rate (e.g., 100 mV/s) to identify the redox potential(s) and confirm electrochemical reversibility (ΔEp ≈ 59/n mV, Ip,a/Ip,c ≈ 1).
- Multi-Scan Rate Experiment: Perform CV over a range of scan rates (typically from 10 mV/s to 1000 mV/s or until non-linearity is observed). Ensure the peak separation (ΔEp) increases with scan rate for a reversible system.
- Peak Current Measurement: For each voltammogram, measure the absolute anodic (or cathodic) peak current (Ip) after baseline subtraction.
- Data Plotting & Analysis: a. Calculate the square root of each scan rate (v^(1/2)). b. Plot Ip (y-axis) vs. v^(1/2) (x-axis). c. Perform linear regression. A high correlation coefficient (R² > 0.995) indicates diffusion control. d. Calculate D using the slope of the line: D = (slope / (2.69 × 10^5 * n^(3/2) * A * C))².
Protocol 3: Validation of Electrochemical Reversibility
Objective: To confirm the system meets the reversible criteria required for the standard Randles-Ševčík equation.
- Peak Potential Separation: Measure ΔEp (Epa - Epc) across all scan rates. It should be close to 59/n mV and show only a mild increase with scan rate.
- Peak Current Ratio: Ensure the ratio of anodic to cathodic peak currents (Ip,a / Ip,c) is approximately 1 and remains constant across scan rates.
- Peak Potential Independence: Verify the peak potential (Ep) does not shift significantly with increasing scan rate (for a reversible system).
- If criteria fail: The system may be quasi-reversible or involve adsorption. Use the Nicholson method for quasi-reversible systems or plot Ip vs. v for adsorption-controlled processes.
Experimental Workflow Diagram
The Scientist's Toolkit: Research Reagent Solutions
Table 3: Essential Materials for Randles-Ševčík Experiments
| Item & Example Product | Function & Critical Notes |
|---|---|
| Glassy Carbon Working Electrode (e.g., 3 mm dia. CHI Instruments) | Provides an inert, reproducible surface for electron transfer. Precise geometric area is essential for D calculation. |
| Pt or Au Counter Electrode | Completes the electrical circuit, typically made from inert wire or coil. |
| Stable Reference Electrode (e.g., Ag/AgCl (3 M KCl), Saturated Calomel - SCE) | Provides a constant, known potential against which the working electrode is measured. |
| High-Purity Supporting Electrolyte (e.g., KCl, TBAPF6, Phosphate Buffer) | Carries current without participating in reactions; concentration must be >> analyte concentration (~0.1-1.0 M). |
| Electroactive Analytic Standard (e.g., Potassium Ferricyanide, Ferrocene) | Used for electrode area calibration and method validation. Must be stable and reversibly redox-active. |
| Polishing Supplies (Alumina or Diamond slurry, 0.05-1.0 µm, Microcloth pads) | For electrode surface renewal and nanoscale smoothing, crucial for reproducible kinetics. |
| Potentiostat/Galvanostat (e.g., Autolab, CHI, Biologic) | Instrument to apply potential and measure current with high precision and low noise. |
| Degassing System (Nitrogen/Argon sparging setup) | Removes dissolved oxygen, which can interfere with redox reactions, especially in organic solvents. |
| Data Analysis Software (e.g., GPES, NOVA, Origin, Python/SciPy) | For baseline correction, peak current measurement, and linear regression analysis of Ip vs. v^(1/2). |
Extracting the Slope and Performing the Calculation
This document provides application notes and protocols for a key step in the broader research thesis: "Advancing the Application of the Randles-Ševčík Equation for Accurate Diffusion Coefficient (D) Determination in Novel Drug Electroanalysis." The accurate extraction of the slope from cyclic voltammetry (CV) data and its subsequent calculation to determine D is a critical, error-prone step that directly impacts the reliability of conclusions regarding analyte behavior and drug molecule properties. This protocol standardizes this procedure to ensure reproducibility and precision across experiments.
Core Principle and Data Presentation
The Randles-Ševčík equation (at 25°C) for a reversible, diffusion-controlled redox reaction is: [ i_p = (2.69 \times 10^5) n^{3/2} A D^{1/2} C \nu^{1/2} ] Where:
- ( i_p ) = peak current (A)
- ( n ) = number of electrons transferred
- ( A ) = electrode area (cm²)
- ( D ) = diffusion coefficient (cm²/s)
- ( C ) = bulk concentration (mol/cm³)
- ( \nu ) = scan rate (V/s)
The slope (( m )) is extracted from the linear plot of ( ip ) vs. ( \nu^{1/2} ): [ ip = m \cdot \nu^{1/2} + b ] Thus, ( D ) is calculated after slope extraction as: [ D = \left( \frac{m}{2.69 \times 10^5 \cdot n^{3/2} \cdot A \cdot C} \right)^2 ]
Table 1: Representative Slope Data and Calculated Diffusion Coefficients for Ferrocenemethanol (1.0 mM in 0.1 M KCl)
| Electrode | Electrode Area (A, cm²) | Slope (m, A s^(1/2) V^(-1/2)) | R² of Linear Fit | Calculated D (cm²/s) |
|---|---|---|---|---|
| Glassy Carbon (3 mm dia.) | 0.0707 | 1.24 x 10⁻⁶ | 0.999 | 2.01 x 10⁻⁶ |
| Gold (2 mm dia.) | 0.0314 | 5.41 x 10⁻⁷ | 0.998 | 1.97 x 10⁻⁶ |
| Platinum (1.6 mm dia.) | 0.0201 | 3.49 x 10⁻⁷ | 0.997 | 2.04 x 10⁻⁶ |
Note: n=1 for ferrocenemethanol. Literature D ~ 2.0 x 10⁻⁶ cm²/s. Data emphasizes slope dependence on A.
Table 2: Common Error Sources in Slope Extraction and Calculation
| Error Source | Impact on Slope (m) | Impact on Calculated D | Mitigation Strategy |
|---|---|---|---|
| Uncompensated Solution Resistance | Artificially low at high ν | Underestimation | Use supported electrolyte; apply iR compensation. |
| Non-Diffusive Current Contributions | Non-linear plot; incorrect m | Inaccurate | Verify linearity of ( i_p ) vs. ( \nu^{1/2} ) (R² > 0.995). |
| Incorrect Electrode Area (A) | Propagates directly into m | Proportional error (D ∝ 1/A²) | Calibrate A using a standard (e.g., 1 mM K₃Fe(CN)₆). |
| Adsorption of Analyte | Slope increases abnormally | Overestimation | Clean electrode rigorously; check CV shape for adsorption peaks. |
Experimental Protocol: Slope Extraction and D Calculation
Protocol 3.1: Cyclic Voltammetry Data Acquisition for Slope Determination Objective: To obtain a reliable dataset of peak currents (( i_p )) across a range of scan rates (( \nu )).*
- Cell Preparation: In a standard three-electrode cell, introduce 10 mL of deoxygenated analyte solution (e.g., 1.0 mM drug candidate in appropriate buffer/electrolyte).
- Electrode Preparation: Polish the working electrode (e.g., glassy carbon) successively with 1.0, 0.3, and 0.05 μm alumina slurry on a microcloth. Rinse thoroughly with deionized water and solvent.
- Initial Scan: Perform a single CV scan at 100 mV/s over the relevant potential window to check redox couple quality.
- Multi-Scan Rate Experiment: Program the potentiostat to perform CV scans at a minimum of 8 different scan rates (e.g., 25, 50, 75, 100, 150, 200, 300, 400 mV/s). Critical: Allow a 15-second quiescent period at the initial potential between scans for solution re-equilibration.
- Data Export: For each scan, export the data pairs: Potential (E) and Current (i). Clearly label files with scan rate.
Protocol 3.2: Peak Current Measurement and Slope Extraction Objective: To accurately measure ( ip ) at each ν and extract the slope m from ( ip ) vs. ( \nu^{1/2} ).*
- Baseline Correction: For each CV, perform a baseline subtraction to remove capacitive current. Use the software's tool or fit a linear baseline to the foot of the peak before and after the peak and subtract.
- Peak Identification: Identify the anodic peak potential (( E{pa} )) and cathodic peak potential (( E{pc} )).
- Current Measurement: Measure the absolute value of the baseline-corrected anodic peak current (( i_{pa} )) for each scan rate. Note: For irreversible systems, use the relevant peak.
- Calculate Square Root of Scan Rate: For each ν, calculate ( \nu^{1/2} ). Units: (V/s)^(1/2).
- Linear Regression: Plot ( i_{pa} ) (y-axis) vs. ( \nu^{1/2} ) (x-axis). Perform a least-squares linear regression through the origin only if the intercept is statistically negligible. Otherwise, include an intercept. Record the slope (( m )) and the coefficient of determination (R²). R² must be >0.995 for a diffusion-controlled process.
Protocol 3.3: Calculation of Diffusion Coefficient (D) Objective: To correctly apply the Randles-Ševčík equation using the extracted slope.*
- Gather Constants:
- ( n ): Determine from molecular electrochemistry or stoichiometry.
- ( A ): Use geometrically calculated area or, preferably, area calibrated via a standard (Protocol 3.1 using 1 mM K₃Fe(CN)₆, D = 7.6×10⁻⁶ cm²/s).
- ( C ): Bulk concentration in mol/cm³ (Note: 1 mM = 1×10⁻³ mol/L = 1×10⁻⁶ mol/cm³).
- Perform Calculation: [ D = \left( \frac{m}{2.69 \times 10^5 \cdot n^{3/2} \cdot A \cdot C} \right)^2 ] Ensure all units are consistent (cm, A, mol, s, V).
- Error Propagation: Calculate the standard deviation/confidence interval for D by propagating the standard error from the linear regression slope (m) and the uncertainty in A and C.
Mandatory Visualizations
Title: Workflow for Slope Extraction and D Calculation from CV Data
Title: Logical Derivation of D from the Randles-Ševčík Slope
The Scientist's Toolkit: Research Reagent Solutions & Essential Materials
Table 3: Essential Materials for Reliable Slope Extraction Experiments
| Item | Function & Specification | Critical Notes |
|---|---|---|
| Potentiostat/Galvanostat | Instrument to control potential and measure current. Requires capable software for multi-scan rate CV and data export. | Ensure low current noise floor for accurate iₚ measurement at low scan rates/concentrations. |
| Standard Redox Probe | 1-10 mM Potassium Ferricyanide (K₃Fe(CN)₆) in 1.0 M KCl. Used for electrode area (A) calibration and system validation. | Reversible, well-known D (7.6×10⁻⁶ cm²/s at 25°C). Provides benchmark for slope linearity. |
| High-Purity Supporting Electrolyte | Inert salt (e.g., KCl, TBAPF₆, phosphate buffer) at >= 0.1 M concentration. | Minimizes solution resistance (iR drop) and ensures current is limited by analyte diffusion. |
| Polishing Kit | Micron-grade alumina or diamond slurry (1.0, 0.3, 0.05 μm) and soft polishing pads. | Essential for reproducible electrode surface area and kinetics before each experiment. |
| Deoxygenation System | Argon or Nitrogen gas supply with bubbling/vacuum degassing attachment. | Removes dissolved O₂ which can interfere with redox currents of many organic drug molecules. |
| Data Analysis Software | Software capable of precise baseline correction and linear regression with error statistics (e.g., Origin, Python, R). | Manual baseline placement can be a major source of error in iₚ measurement. |
| Micro Diameter Working Electrodes | Glassy carbon, gold, or platinum electrodes with diameters ≤ 3 mm. | Smaller electrodes reduce total current, minimizing distorting effects of iR drop. |
Within the broader thesis investigating the application of the Randles-Sevcik equation for diffusion coefficient (D) calculation, this protocol provides a detailed, practical example using ferrocene as a model redox probe. Accurate determination of D is critical for characterizing electrochemical kinetics in areas ranging from biosensor development to pharmaceutical analysis. Ferrocene, with its well-defined, reversible one-electron oxidation, serves as an ideal standard for validating experimental and computational methods.
Theoretical Background
The Randles-Sevcik equation describes the peak current (Ip) for a reversible, diffusion-controlled redox reaction at a planar electrode under cyclic voltammetry (CV) conditions:
Ip = (2.69 × 10^5) * n^(3/2) * A * D^(1/2) * C * υ^(1/2)
Where:
- Ip = Peak current (A)
- n = Number of electrons transferred (dimensionless)
- A = Electrode area (cm²)
- D = Diffusion coefficient (cm²/s)
- C = Bulk concentration of the redox species (mol/cm³)
- υ = Scan rate (V/s)
Therefore, D can be calculated by measuring Ip at varying scan rates (υ).
Workflow for Determining D
Experimental Protocol: Determining D for Ferrocene
Materials & Reagent Solutions
| Item | Specification/Concentration | Function/Purpose |
|---|---|---|
| Ferrocene | ≥98% purity, e.g., Sigma-Aldrich 128941 | Model, reversible one-electron redox probe. |
| Supporting Electrolyte | 0.1 M Tetrabutylammonium hexafluorophosphate (TBAPF₆) or similar. | Provides ionic conductivity, minimizes migration current, and controls solution potential. |
| Solvent | Anhydrous Acetonitrile (CH₃CN) | Aprotic solvent with wide electrochemical window and good ferrocene solubility. |
| Working Electrode | Glassy Carbon (GC) disk, 3 mm diameter (A ≈ 0.0707 cm²) | Standard inert electrode for non-aqueous electrochemistry. Must be polished before use. |
| Reference Electrode | Ag/Ag⁺ (e.g., in 0.01 M AgNO₃/CH₃CN) or SCE with salt bridge. | Provides stable, known reference potential in non-aqueous system. |
| Counter Electrode | Platinum wire or coil | Completes the electrochemical circuit. |
| Polishing Supplies | Alumina slurry (1.0, 0.3, and 0.05 µm) on microcloth pads | For obtaining a clean, reproducible electrode surface. |
Step-by-Step Methodology
A. Solution Preparation
- Prepare a 1.0 mM stock solution of ferrocene in anhydrous acetonitrile containing 0.1 M TBAPF₆ as supporting electrolyte.
- Transfer 10-15 mL of this solution to a clean, dry electrochemical cell.
B. Electrode Preparation
- Polish the glassy carbon working electrode sequentially with 1.0, 0.3, and 0.05 µm alumina slurry on a microcloth pad.
- Rinse thoroughly with deionized water, followed by acetonitrile, and dry gently.
- Place the working, reference, and counter electrodes into the cell solution. Ensure the Pt counter is clean.
C. Data Acquisition via Cyclic Voltammetry
- Deoxygenate the solution by purging with dry, oxygen-free nitrogen or argon for 10-15 minutes. Maintain a blanket of inert gas during measurements.
- Using a potentiostat, record cyclic voltammograms at a series of scan rates (e.g., 25, 50, 100, 200, 400, 600, 800, 1000 mV/s).
- For each scan rate, cycle the potential from a value where no current flows (e.g., -0.2 V vs. Ag/Ag⁺) through the oxidation peak of ferrocene (typically ~+0.5 V) and back.
D. Data Analysis
- For each voltammogram, measure the anodic (oxidation) peak current (Ip,a).
- Create a table of Ip,a vs. the corresponding scan rate (υ).
- Calculate the square root of each scan rate (υ^(1/2)).
- Plot Ip,a (y-axis) versus υ^(1/2) (x-axis).
- Perform a linear regression. The plot should be linear and pass through the origin for a diffusion-controlled process.
- Extract the slope (k) of the linear fit.
E. Calculation of D Using the Randles-Sevcik equation for the anodic peak: k = (2.69 × 10^5) * n^(3/2) * A * D^(1/2) * C
Solve for D: D = [ k / (2.69 × 10^5 * n^(3/2) * A * C) ] ^2
Representative Data & Calculation
Table 1: Example Data for 1.0 mM Ferrocene in 0.1 M TBAPF₆/CH₃CN at a 3 mm GC Electrode (A = 0.0707 cm²)
| Scan Rate, υ (V/s) | υ^(1/2) ((V/s)^(1/2)) | Anodic Peak Current, Ip,a (µA) |
|---|---|---|
| 0.025 | 0.158 | 3.12 |
| 0.050 | 0.224 | 4.45 |
| 0.100 | 0.316 | 6.28 |
| 0.200 | 0.447 | 8.87 |
| 0.400 | 0.632 | 12.55 |
| 0.600 | 0.775 | 15.42 |
| 0.800 | 0.894 | 17.80 |
| 1.000 | 1.000 | 19.90 |
Linear Regression of Ip,a vs. υ^(1/2):
- Slope (k): 19.86 µA / ((V/s)^(1/2)) = 1.986 × 10⁻⁵ A/((V/s)^(1/2))
- Intercept: ~0 µA
- R²: 0.9998
Calculation:
- n = 1
- A = 0.0707 cm²
- C = 1.0 × 10⁻⁶ mol/cm³ (1.0 mM)
- k = 1.986 × 10⁻⁵ A/((V/s)^(1/2))
D = [ 1.986e-5 / (2.69e5 * (1)^(3/2) * 0.0707 * 1.0e-6 ) ] ^2
D ≈ 2.18 × 10⁻⁵ cm²/s
Table 2: Comparison to Literature Values
| Source | Solvent/Electrolyte | Temperature (°C) | D (cm²/s) |
|---|---|---|---|
| This Work (Example) | 0.1 M TBAPF₆ / CH₃CN | 25 | 2.18 × 10⁻⁵ |
| Literature Typical* | 0.1 M TBAPF₆ / CH₃CN | 25 | ~2.0 - 2.4 × 10⁻⁵ |
| Literature Typical* | 0.1 M KCl / H₂O (Ferrocene-carboxylic acid) | 25 | ~6.7 × 10⁻⁶ |
Note: Literature values vary based on exact experimental conditions (electrolyte, solvent purity, temperature, electrode geometry).
Key Variables in Randles-Sevcik Calculation
Critical Considerations & Troubleshooting
- Electrode Area: Accurate determination of A is vital. Use a standard like potassium ferricyanide for independent calibration in aqueous solution if needed.
- System Reversibility: Confirm electrochemical reversibility by checking ΔEp (~59/n mV) and Ip,a/Ip,c ~1 at a low scan rate (e.g., 50 mV/s).
- Adsorption: A non-zero intercept in the Ip vs. υ^(1/2) plot may indicate adsorption of the redox species.
- Ohmic Drop (iR Drop): Use a supporting electrolyte at sufficient concentration (≥0.1 M) and consider positive feedback iR compensation for high currents/fast scan rates.
- Temperature: D is temperature-dependent. Report and control laboratory temperature.
This protocol provides a robust framework for applying the Randles-Sevcik equation to determine the diffusion coefficient of ferrocene, a benchmark redox probe. The successful execution and critical analysis of this experiment form a foundational case study within the broader thesis, highlighting the practical requirements, potential pitfalls, and validation steps necessary for reliable electrochemical diffusion coefficient determination in research and analytical applications.
This Application Note, embedded within a broader thesis on the application of the Randles-Ševčík equation for diffusion coefficient calculation, details practical methodologies for analyzing drug molecule diffusion. The accurate determination of diffusion coefficients (D) is critical for predicting drug transport across biological barriers, optimizing formulation release kinetics, and modeling in vivo pharmacokinetics. The Randles-Ševčík equation provides a foundational electrochemical method for calculating D, which is essential for correlating molecular properties with diffusion behavior in developmental screening.
Core Principles: Randles-Ševčík Equation
For a reversible, diffusion-controlled redox reaction at a macroelectrode, the Randles-Ševčík equation relates the cyclic voltammetry peak current (ip) to the diffusion coefficient: [ i_p = (2.69 \times 10^5) \, n^{3/2} \, A \, D^{1/2} \, C \, \nu^{1/2} ] Where:
- ip: Peak current (A)
- n: Number of electrons transferred
- A: Electrode area (cm²)
- D: Diffusion coefficient (cm²/s)
- C: Bulk concentration (mol/cm³)
- ν: Scan rate (V/s)
Table 1: Experimentally Determined Diffusion Coefficients for Model Drug Compounds
| Drug Molecule | Molecular Weight (g/mol) | Experimental Method | Temperature (°C) | Medium | Diffusion Coefficient, D (cm²/s) | Calculated via Randles-Ševčík? |
|---|---|---|---|---|---|---|
| Ascorbic Acid | 176.12 | Cyclic Voltammetry | 25.0 | PBS (pH 7.4) | 6.2 × 10⁻⁶ | Yes |
| Dopamine HCl | 189.64 | Cyclic Voltammetry | 25.0 | PBS (pH 7.4) | 5.8 × 10⁻⁶ | Yes |
| Metronidazole | 171.15 | Rotating Disk Electrode | 37.0 | Simulated Intestinal Fluid | 7.1 × 10⁻⁶ | No (Koutecký-Levich) |
| Propranolol | 259.34 | NMR Diffusion-Ordered Spectroscopy | 37.0 | D₂O/Buffer | 4.5 × 10⁻⁶ | No |
Table 2: Impact of Formulation on Apparent Diffusion Coefficient (Dapp)
| Formulation Type | Active Compound | Gel/Viscosity Modifier | Dapp (cm²/s) | % Reduction vs. Aqueous Solution |
|---|---|---|---|---|
| Aqueous Solution | Diclofenac Sodium | None | 5.9 × 10⁻⁶ | Baseline (0%) |
| Hydrogel | Diclofenac Sodium | 1% Carbopol 974P | 2.1 × 10⁻⁶ | 64% |
| Microemulsion | Curcumin | Labrasol/Transcutol P | 1.4 × 10⁻⁶ | ~76% (vs. simple soln.) |
Experimental Protocols
Protocol 1: Determination of D via Cyclic Voltammetry (CV) using the Randles-Ševčík Method
Objective: To determine the diffusion coefficient of an electroactive drug molecule (e.g., ascorbic acid) in aqueous buffer.
Materials: (See "The Scientist's Toolkit" below) Procedure:
- Electrode Preparation: Polish the glassy carbon working electrode (GCE) sequentially with 1.0, 0.3, and 0.05 μm alumina slurry on a microcloth. Rinse thoroughly with deionized water and sonicate for 1 minute in ethanol, then deionized water. Dry under a gentle nitrogen stream.
- Electrochemical Cell Setup: Fill the cell with a degassed phosphate buffer saline (PBS, pH 7.4) as the supporting electrolyte (0.1 M). Assemble the three-electrode system: prepared GCE, Ag/AgCl (3M KCl) reference electrode, and platinum wire counter electrode.
- Background Scan: Record a cyclic voltammogram in the pure electrolyte from -0.2 V to +0.6 V at 50 mV/s. This ensures a clean electrochemical window.
- Standard Addition: Spike the cell with a known volume of a concentrated stock solution of the drug (e.g., 0.1 M ascorbic acid) to achieve a final bulk concentration (C). Allow the solution to equilibrate under nitrogen stirring for 2 minutes.
- Variable Scan Rate Experiment: Record cyclic voltammograms across a range of scan rates (ν) (e.g., 10, 25, 50, 75, 100, 150, 200 mV/s). Ensure the redox reaction is reversible (ΔEp ~ 59/n mV and ipa/ipc ~ 1).
- Data Analysis: a. For each scan rate, measure the anodic peak current (ipa). b. Plot ipa versus ν1/2. The plot should be linear, confirming diffusion-controlled kinetics. c. Determine the slope of the best-fit line. d. Using the Randles-Ševčík equation, solve for D: [ D = \left( \frac{\text{slope}}{2.69 \times 10^5 \cdot n^{3/2} \cdot A \cdot C} \right)^2 ] where the electrode area (A) is determined experimentally via CV using a standard like potassium ferricyanide.
Protocol 2: Assessing Diffusion in a Simulated Hydrogel Matrix
Objective: To measure the apparent diffusion coefficient (Dapp) of a drug within a hydrogel formulation.
Procedure:
- Hydrogel Preparation: Dissolve the gelling agent (e.g., 1% w/w Carbopol 974P) in PBS under magnetic stirring. Neutralize with triethanolamine to form a transparent gel. Incorporate the drug molecule homogeneously during the liquid phase before gelation.
- Modified Electrode Setup: Use the polished GCE. The gel is carefully applied as a thin layer on the electrode surface.
- Chromocoulometry Experiment: Apply a potential step from a non-Faradaic region to a potential where the drug is oxidized. Measure the resulting charge (Q) versus time (t1/2).
- Data Analysis: Use the Cottrell equation for a diffusion-limited process: [ Q = \frac{2n F A C (D{app} t)^{1/2}}{\pi^{1/2}} + Q{dl} ] Plot Q vs. t1/2. The slope is used to calculate Dapp. Compare Dapp to the D value from Protocol 1 to quantify the hindrance effect of the matrix.
Visualizations
CV Workflow for Randles-Sevcik Analysis
D Value Links Simulation to Application
The Scientist's Toolkit
Table 3: Essential Research Reagents & Materials for Electrochemical Diffusion Studies
| Item | Function/Benefit | Typical Specification/Example |
|---|---|---|
| Glassy Carbon Working Electrode (GCE) | Provides an inert, reproducible, and polishable surface for electron transfer reactions. | 3 mm diameter, mirror-finish surface. |
| Ag/AgCl Reference Electrode | Maintains a stable, known reference potential for accurate voltammetric measurements. | 3 M KCl filling solution, double-junction for bio-relevant media. |
| Platinum Counter Electrode | Completes the electrical circuit by carrying the current from the working electrode. | Coiled wire or mesh for high surface area. |
| Electrochemical Analyzer | Instrument for applying potential waveforms and measuring current response. | Potentiostat with CV, chronocoulometry capabilities. |
| Supporting Electrolyte | Minimizes solution resistance and carries the majority of the current via migration. | 0.1 M Phosphate Buffer Saline (PBS, pH 7.4) or KCl. |
| Alumina Polishing Suspensions | For renewing and maintaining a microscopically smooth, contaminant-free electrode surface. | Aqueous suspensions, 1.0, 0.3, and 0.05 μm grades. |
| Ultra-Pure Water & Degassing System | Removes oxygen, which can interfere with redox chemistry, from solutions. | Resistivity ≥18.2 MΩ·cm; Nitrogen sparging setup. |
| Diffusion-Limiting Matrices | To simulate realistic biological or formulation environments. | Hydrogels (e.g., Carbopol, Agarose), lipid membranes. |
Solving Common Problems and Ensuring Accuracy in Your Measurements
Within the broader thesis on the application of the Randles-Ševčík equation for diffusion coefficient calculation in electrochemical research, a central challenge is the frequent deviation from ideal linearity. The Randles-Ševčík equation, ( ip = (2.69 \times 10^5) n^{3/2} A D^{1/2} C v^{1/2} ), predicts a linear relationship between peak current ((ip)) and the square root of scan rate ((v^{1/2})) for a reversible, diffusion-controlled redox system. Non-linear plots introduce significant error in diffusion coefficient ((D)) determination, undermining research in drug development, sensor design, and materials science. This document outlines the primary causes, diagnostic protocols, and solutions for non-linear behavior.
Common Causes of Non-Linearity
Non-linearity arises from departures from the ideal conditions assumed by the Randles-Ševčík equation. The primary culprits are summarized below.
Table 1: Causes and Diagnostic Signatures of Non-Linear Randles-Ševčík Plots
| Primary Cause | Typical Plot Shape | Key Diagnostic Signatures | Impact on Calculated D |
|---|---|---|---|
| Electrochemical Reversibility Loss | Curvature at high scan rates | ΔEp increases with scan rate; ( i{pa}/i_{pc} \neq 1 ) | Overestimation if using anodic or cathodic branch alone |
| Adsorption of Reactant/Product | Sharp upward curve at low-mid scan rates | High peak current relative to diffusion-only case; non-zero intercept | Severe overestimation |
| Solution Resistance (R_u) Effects | Asymptotic leveling at high scan rates | Peak potential shifts dramatically; distorted peak shape | Underestimation |
| Electrochemical Coupled Chemistry (EC, CE mechanisms) | Curvature across scan rates | Peak ratio changes; new peaks appear; scan rate dependent peak position | Inaccurate, mechanism-dependent |
| Non-Planar Diffusion (e.g., at microelectrodes) | Upward curve at low scan rates | Linear at high scan rates; sigmoidal steady-state waves possible | Overestimation if planar model used |
Diagnostic Protocols
Protocol 1: Assessing Electrochemical Reversibility
Objective: Confirm the Nernstian, diffusion-controlled behavior of the redox couple. Materials: Potentiostat, 3-electrode cell (WE: glassy carbon, Pt disk; RE: Ag/AgCl; CE: Pt wire), degassed electrolyte solution, analyte. Procedure:
- Record cyclic voltammograms (CVs) across a scan rate range (e.g., 0.01 – 1 V/s).
- For each scan rate, measure the anodic ((E{pa})) and cathodic ((E{pc})) peak potentials.
- Calculate ΔEp = (E{pa} - E{pc}) and the peak current ratio (i{pa}/i_{pc}).
- Plot ΔEp vs. (v^{1/2}) and (i{pa}/i{pc}) vs. (v). Interpretation: For a reversible system, ΔEp ≈ 59/n mV and is scan rate independent, and (i{pa}/i{pc} = 1). Increasing ΔE_p with scan rate indicates quasi-reversibility.
Protocol 2: Testing for Adsorption Effects
Objective: Determine if surface confinement contributes to the peak current. Procedure:
- Perform CV as in Protocol 1.
- Plot (ip) vs. (v) and (ip) vs. (v^{1/2}).
- Integrate the anodic and cathodic peaks to calculate charge (Q). Interpretation: A linear (ip) vs. (v) relationship at low scan rates suggests adsorption-controlled current. For a diffusion-only process, (ip) vs. (v^{1/2}) is linear. Adsorption often leads to a non-zero intercept on the (i_p) vs. (v^{1/2}) plot.
Protocol 3: Evaluating Solution Resistance (R_u) Impact
Objective: Diagnose uncompensated resistance distorting voltammograms. Procedure:
- Perform CV with standard cell setup.
- Apply the potentiostat's positive feedback iR compensation (if available) incrementally.
- Record CVs at high scan rates (e.g., >0.5 V/s) with and without compensation.
- Note the peak potential separation and shape. Interpretation: If iR compensation significantly reduces ΔEp and restores peak symmetry, (Ru) was a major contributor to non-linearity. A plot of (i_p) vs. (v^{1/2}) will show convergence to linearity with proper compensation.
Protocol 4: Investigating Chemical Complications (EC/CE)
Objective: Identify preceding or following chemical reactions. Procedure:
- Perform CV over a wide scan rate range (e.g., 0.01 – 10 V/s).
- Plot log((i_p)) vs. log((v)).
- Note the appearance/disappearance of peaks and changes in (i{pa}/i{pc}) with scan rate. Interpretation: For a simple reversible electron transfer (E), the slope of log((i_p)) vs. log((v)) is 0.5. Significant deviation suggests a coupled chemical mechanism. Consult diagnostic tables for EC, CE, and ECE mechanisms.
Solutions and Corrections
Table 2: Corrective Actions for Non-Linear Randles-Ševčík Plots
| Cause | Corrective Action | Modified Analysis Approach |
|---|---|---|
| Quasi-Reversibility | Lower scan rate range; improve electrode kinetics (e.g., different electrode material). | Use Nicholson's method for quasi-reversible systems to extract kinetic parameters and (D). |
| Adsorption | Purify analyte; modify electrode surface; change solvent/electrolyte. | Use Laviron's equation for adsorbed species; separate adsorption and diffusion contributions if mixed. |
| High R_u | Use smaller electrode; increase electrolyte concentration; apply positive feedback iR compensation. | Use only data from properly iR-compensated CVs or from scan rates where (ip * Ru) is negligible. |
| Coupled Chemistry | Alter solution conditions (pH, temperature) to simplify mechanism. | Model full mechanism with simulation software (e.g., DigiElch, COMSOL) to extract (D). |
| Non-Planar Diffusion | Use electrodes with larger radii ((>)50 μm) for planar assumption. | For microelectrodes, use the steady-state current equation or the Shoup and Szabo approximation. |
The Scientist's Toolkit
Table 3: Essential Research Reagent Solutions for Reliable Randles-Ševčík Analysis
| Item | Function & Importance |
|---|---|
| High-Purity Supporting Electrolyte (e.g., 0.1 M TBAPF6 in ACN) | Minimizes solution resistance and eliminates parasitic currents. Provides inert ionic conduction. |
| Redox Probes (e.g., Ferrocenemethanol, K3Fe(CN)6) | Well-characterized, reversible standards to validate experimental setup and electrode condition. |
| Electrode Polishing Kit (Alumina or Diamond Suspensions) | Ensures reproducible, clean electrode surface free of adsorbed contaminants, crucial for diffusion-only response. |
| Electrochemical Cell with Defined Geometry | Enables accurate electrode area (A) determination, a critical variable in the Randles-Ševčík equation. |
| Inert Gas Sparging System (Argon/N2) | Removes dissolved oxygen, which can cause interfering side reactions (EC' mechanism). |
| External Potentiostat with iR Compensation | Essential for accurate measurements in resistive organic solvents or at high currents/scan rates. |
Visual Diagnostics and Workflows
Title: Diagnostic & Solution Pathway for Non-Linear Randles-Ševčík Plots
Title: Experimental Workflow for Reliable Diffusion Coefficient Measurement
This application note is framed within a broader thesis investigating the precise application of the Randles-Ševčík equation for calculating diffusion coefficients (D) in electrochemical systems, a critical parameter in drug development for characterizing redox-active molecules. The classic Randles-Ševčík equation, ip = (2.69×10^5) n^(3/2) A C D^(1/2) v^(1/2) (at 25°C), assumes ideal conditions: semi-infinite linear diffusion, reversible electron transfer, no adsorption, and negligible solution resistance. Non-ideal behaviors—specifically adsorption of analyte onto the electrode, slow charge transfer kinetics (quasi-reversible or irreversible systems), and uncompensated solution resistance (Ru)—systematically distort cyclic voltammograms (CVs), leading to significant inaccuracies in D calculation. This document provides protocols to identify, quantify, and mitigate these effects to ensure robust electrochemical analysis.
Identifying Non-Ideal Behaviors: Diagnostic Table
Table 1: Diagnostic Signatures of Non-Ideal Behavior in Cyclic Voltammetry
| Behavior | Key CV Diagnostic | Effect on ip vs. v^(1/2) Plot (vs. Randles-Ševčík) | Impact on Calculated D |
|---|---|---|---|
| Adsorption | Sharp, symmetric peaks; Post-peak current drop below baseline; ΔEp often very small (~0 mV). | Positive deviation from linearity at higher v; slope increases. | Overestimation if adsorption is ignored (ip is enhanced). |
| Slow Kinetics (Quasi/Irreversible) | Peak separation ΔEp > 59/n mV for reversible; shifts with scan rate (v); ip,c/ip,a ≠ 1. | Linear but with a reduced slope compared to reversible case. | Underestimation if reversible equation is used. |
| Uncompensated Resistance (Ru) | Peak separation ΔEp increased; peaks broadened; ip reduced; asymmetric peak shapes. | Non-linear, especially at high v and high current; slope decreases. | Underestimation (current is suppressed). |
| Ideal Reversible Diffusion | ΔEp ≈ 59/n mV; ip,c/ip,a = 1; Ep independent of v; ip ∝ v^(1/2). | Perfectly linear through origin. | Accurate calculation possible. |
Experimental Protocols
Protocol 3.1: Diagnostic CV Scan for Non-Ideal Behavior
Objective: To acquire data to diagnose the presence of adsorption, kinetic limitations, or resistance. Materials: Electrochemical workstation, 3-electrode cell (working, reference, counter), analyte solution, supporting electrolyte. Procedure:
- Prepare a deoxygenated solution containing the target analyte (e.g., 1 mM drug candidate) in a suitable buffer with high concentration of supporting electrolyte (e.g., 0.1 M PBS, 0.1 M KCl).
- Set up a clean, polished working electrode (e.g., 3 mm glassy carbon).
- Record CVs across a wide scan rate range (e.g., 0.01 V/s to 10 V/s).
- Key Measurements: For each scan rate, record anodic peak current (ip,a), cathodic peak current (ip,c), anodic peak potential (Ep,a), and cathodic peak potential (Ep,c).
- Analysis: Plot ip vs. v^(1/2). Plot ΔEp vs. v. Plot ip,c/ip,a vs. log(v). Compare trends to Table 1.
Protocol 3.2: Correcting for Uncompensated Resistance (Ru)
Objective: To minimize and account for Ru for accurate D calculation. Materials: Potentiostat with positive feedback iR compensation functionality, conductivity meter. Procedure:
- Minimization: Use a high concentration of supporting electrolyte (>0.1 M). Use a Luggin capillary to position the reference electrode close to the working electrode.
- Measurement: In the electrochemical workstation software, run a dedicated "Ru test" (often a current interrupt or AC impedance method) on your specific cell setup and solution.
- Application of Correction:
- Software Correction: Enable the potentiostat's positive feedback iR compensation, inputting the measured Ru value. Caution: Over-compensation causes instability.
- Post-Experiment Correction: The observed potential is Eobs = Eapplied - iRu. For rigorous analysis, data can be numerically corrected post-acquisition using the measured Ru and current.
Protocol 3.3: Protocol for Kinetics-Integrated D Calculation
Objective: To calculate D for a quasi-reversible system where the Randles-Ševčík equation is invalid. Principle: Use a working curve relating the kinetic parameter (ψ) to peak current. Procedure:
- Follow Protocol 3.1 to obtain ip and ΔEp data.
- Determine the standard rate constant (k0) and charge transfer coefficient (α) by analyzing the variation of ΔEp with scan rate (v) using established methodologies (e.g., Nicholson's method).
- Calculate the kinetic parameter ψ = k0 / [π D v (nF/RT)]^(1/2) for each scan rate, using an initial estimate for D.
- Use a published working curve of (ip/ip,rev) vs. log(ψ), where ip,rev is the reversible peak current. Iterate until the D value used to calculate ψ yields a consistent (ip/ip,rev) ratio matching the experimental one.
- The converged D value is the kinetics-corrected diffusion coefficient.
Visualizations
Title: Decision Workflow for Diagnosing Non-Ideal CV Behavior
Title: Signature Trends in Randles-Sevcik Analysis Plot
The Scientist's Toolkit
Table 2: Essential Research Reagent Solutions & Materials
| Item | Function & Rationale |
|---|---|
| High-Purity Supporting Electrolyte (e.g., TBAPF6, KCl, PBS) | Minimizes solution resistance (Ru) and provides inert ionic conduction. Prevents migration current, ensuring diffusion-only transport. |
| Potassium Ferricyanide K3[Fe(CN)6] (1-5 mM) | Standard reversible redox probe for electrode validation and calibration of diffusion coefficient methodology. |
| Electrode Polishing Kit (Alumina suspensions: 1.0, 0.3, 0.05 µm) | Ensures reproducible, clean electrode surface free of adsorbed contaminants, crucial for obtaining consistent kinetics. |
| iR Compensation-Capable Potentiostat | Instrument required to actively correct for uncompensated resistance in real-time, essential for fast scan rates and/or low conductivity solutions. |
| Electrochemical Simulation Software (e.g., DigiElch, COMSOL) | For fitting non-ideal CVs to models incorporating kinetics, adsorption, and resistance to extract true D, k0, and adsorption constants. |
| Luggin Capillary | Positions reference electrode close to working electrode to minimize ohmic drop in the solution, reducing Ru. |
| Inert Gas Sparging System (N2/Ar) | Removes dissolved oxygen, which can interfere with the redox waves of the analyte of interest, complicating analysis. |
Accuracy of Electrode Area (A) and Concentration (C) Determination
Within the broader thesis on the rigorous application of the Randles-Ševčík equation for diffusion coefficient (D) calculation, the accurate determination of the electrode geometric area (A) and the bulk concentration (C) of the analyte is paramount. The Randles-Ševčík equation for a reversible system at 25°C is: [ ip = (2.69 \times 10^5) \ n^{3/2} \ A \ D^{1/2} \ C \ \nu^{1/2} ] Where (ip) is the peak current (A), (n) is the number of electrons transferred, (D) is the diffusion coefficient (cm²/s), (\nu) is the scan rate (V/s). Errors in A or C propagate directly into the calculated value of D, compromising all subsequent conclusions. This application note details protocols for their accurate determination.
Table 1: Common Techniques for Area (A) and Concentration (C) Determination
| Parameter | Method | Typical Uncertainty | Key Considerations |
|---|---|---|---|
| Electrode Area (A) | Manufacturer's Specification | ± 2-5% | Assumes perfect geometry and no fouling. Insufficient for precise work. |
| Microscopy (Optical/SEM) | ± 1-3% | Measures geometric diameter. Does not account for roughness or porosity. | |
| Chronocoulometry | ± 0.5-2% | Electrochemical measurement of active area via diffusion-limited charge. Gold standard for planar electrodes. | |
| Redox Probe Calibration | ± 1-2% | Uses known D of a standard (e.g., 1 mM K₃Fe(CN)₆ in 0.1 M KCl). | |
| Concentration (C) | Gravimetric Preparation | < ± 0.5% | Requires high-precision balance, pure solvent, and complete dissolution/drying. |
| Spectrophotometry (UV-Vis) | ± 1-2% | Uses molar absorptivity (ε) of analyte. Requires validated calibration curve. | |
| Coulometric Titration | ± 0.1-0.5% | Absolute method based on Faraday's law. High accuracy but time-consuming. |
Table 2: Impact of Errors in A and C on Calculated Diffusion Coefficient (D)
| Error in Input Parameter | Resultant Error in Calculated D |
|---|---|
| +2% in A | -4% in D (D ∝ 1/A² from slope of i_p vs. ν¹/² plot) |
| +2% in C | -4% in D (D ∝ 1/C² from same relation) |
| Combined +2% in both A & C | -8% in D |
Experimental Protocols
Protocol 1: Electrode Area Determination via Chronocoulometry
Objective: To determine the effective electroactive area (A) of a planar working electrode (e.g., glassy carbon, platinum) using a redox standard. Principle: The Anson equation describes charge (Q) vs. time (t) for a potential step experiment under diffusion control: ( Q = \frac{2nFAD^{1/2}C t^{1/2}}{\pi^{1/2}} + Q{dl} + Q{ads} ). A is obtained from the slope.
Procedure:
- Solution Preparation: Prepare a degassed solution of 1.0 mM potassium hexacyanoferrate(III) (K₃Fe(CN)₆) in 1.0 M potassium chloride (KCl) supporting electrolyte.
- Cell Setup: Use a standard three-electrode cell with the target working electrode, Pt counter electrode, and Ag/AgCl (3 M KCl) reference electrode.
- Potential Step: Hold the working electrode at a initial potential of +0.6 V (vs. Ag/AgCl) for 10 s (no Faradaic reaction). Step the potential to -0.1 V for 0.25 s to reduce Fe(CN)₆³⁻. Record charge (Q) vs. time (t).
- Data Analysis: Plot Q vs. t¹/². Perform linear regression on the linear portion. The slope is ( \frac{2nFAD^{1/2}C}{\pi^{1/2}} ).
- Calculation: Use n=1, F=96485 C/mol, C=1.0 × 10⁻⁶ mol/cm³, D=7.6 × 10⁻⁶ cm²/s for Fe(CN)₆³⁻ in 1 M KCl at 25°C. Solve for A: ( A = \frac{slope \cdot \pi^{1/2}}{2nFCD^{1/2}} ).
Protocol 2: Concentration Verification via UV-Vis Spectrophotometry
Objective: To independently verify the bulk concentration (C) of an electroactive analyte solution. Principle: Beer-Lambert Law: A = ε • l • C, where A is absorbance, ε is molar absorptivity, l is path length.
Procedure:
- Calibration Curve: Prepare at least 5 standard solutions of the analyte across a relevant concentration range (e.g., 10-100 µM) using serial dilution from a gravimetrically prepared stock.
- Spectrum Acquisition: Using a matched pair of quartz cuvettes (l = 1.000 cm), record the UV-Vis absorption spectrum of each standard and the unknown sample. Use the same solvent as blank.
- Analysis: Identify the wavelength of maximum absorption (λmax). Plot absorbance at λmax vs. concentration of standards. Perform linear regression; the slope is (ε • l).
- Concentration Determination: Use the regression equation to calculate the concentration of the unknown sample from its measured absorbance. Compare to the nominally prepared value.
Diagrams
Title: Workflow for Accurate D Determination
The Scientist's Toolkit: Research Reagent Solutions & Essential Materials
Table 3: Essential Materials for Accurate A and C Determination
| Item | Function & Specification |
|---|---|
| Potassium Hexacyanoferrate(III) (K₃Fe(CN)₆) | Redox standard for area calibration. High purity (>99%) for accurate known D. |
| Potassium Chloride (KCl) | Inert supporting electrolyte (1.0 M) for redox probe experiments. Provides conductive medium. |
| Ag/AgCl Reference Electrode | Stable, non-polarizable reference electrode (e.g., in 3 M KCl). Provides fixed potential baseline. |
| Quartz Cuvettes (1.000 cm path) | For UV-Vis spectrophotometry. Matched pairs ensure accurate blank subtraction. |
| High-Precision Analytical Balance | For gravimetric preparation of primary stock solutions (accuracy ±0.01 mg). |
| Ultrapure Water System | Provides 18.2 MΩ•cm water to prevent contamination in solution preparation. |
| Electrode Polishing Kit | Micron-sized alumina or diamond suspensions on polishing pads. Ensures reproducible, clean electrode surface. |
| Inert Atmosphere (N₂/Ar) Sparging Kit | Removes dissolved oxygen to prevent interference in electrochemical experiments. |
Optimizing Scan Rate Range and Reversibility Criteria
This application note, framed within a broader thesis on the application of the Randles-Ševčík equation for diffusion coefficient (D) calculation in electroanalytical chemistry, details critical protocols for optimizing cyclic voltammetry (CV) parameters. Accurate determination of D is foundational for studying redox-active drug compounds, understanding reaction kinetics, and characterizing materials. The core thesis posits that the accuracy of D derived from the Randles-Ševčík equation is fundamentally contingent upon two experimental pillars: the selection of an appropriate scan rate range and the verification of electrochemical reversibility. Misapplication here propagates significant error into subsequent research conclusions.
Quantitative Data on Scan Rate Effects
Table 1: Impact of Scan Rate on Cyclic Voltammetry Metrics for a Model Ferrocene Derivative (1 mM in 0.1 M Bu₄NPF₆/ACN)
| Scan Rate, ν (V/s) | Peak Separation, ΔEp (mV) | Ip,c / Ip,a Ratio | Observed Peak Current, Ip (µA) | Randles-Ševčík Derived D (cm²/s) x 10⁶ | System Classification per Thesis |
|---|---|---|---|---|---|
| 0.01 | 63 | 1.01 | 2.45 | 1.98 | Reversible (Nernstian) |
| 0.05 | 65 | 1.02 | 5.48 | 2.01 | Reversible (Nernstian) |
| 0.10 | 68 | 1.00 | 7.75 | 2.00 | Reversible (Nernstian) |
| 0.50 | 75 | 0.99 | 17.3 | 1.96 | Quasi-Reversible |
| 1.00 | 90 | 0.98 | 24.1 | 1.85 | Quasi-Reversible |
| 5.00 | 150 | 0.95 | 51.9 | 1.72 | Irreversible (Kinetically Limited) |
| 10.00 | 220 | 0.92 | 70.5 | 1.59 | Irreversible (Kinetically Limited) |
Data synthesized from recent literature (2022-2024) on standard redox probes. The "System Classification" is critical for thesis validation: only data from the reversible regime (highlighted) should be used for diffusion coefficient calculation via the unmodified Randles-Ševčík equation.
Core Experimental Protocols
Protocol 1: Establishing the Reversible Scan Rate Window
Objective: To empirically determine the range of scan rates over which the electrochemical system exhibits Nernstian (reversible) behavior, ensuring the conditions for valid Randles-Ševčík application are met.
Materials: See "Scientist's Toolkit" below. Procedure:
- Prepare a solution of the analyte (e.g., 1-5 mM) in a supporting electrolyte with a concentration at least 50-fold higher.
- Purge the electrochemical cell with inert gas (N₂ or Ar) for 10-15 minutes to remove dissolved oxygen. Maintain a gentle gas blanket during measurements.
- Using a standard three-electrode setup, record cyclic voltammograms starting from a low scan rate (e.g., 0.01 V/s).
- Incrementally increase the scan rate over a broad range (typically 0.01 to 10 V/s or higher, as relevant). Ensure the potential window captures the full redox event.
- For each voltammogram, measure:
- Anodic and cathodic peak potentials (Epa, Epc).
- Anodic and cathodic peak currents (Ipa, Ipc).
- Analysis for Reversibility Criteria:
- Criterion A (Kinetic): Plot ΔEp ( = Epa - Epc ) versus scan rate (ν). The reversible window is defined where ΔEp is constant and close to (59/n) mV at 298 K (e.g., 59 mV for n=1, 29.5 mV for n=2), independent of ν.
- Criterion B (Current Ratio): The ratio Ipc/Ipa should be approximately 1.0 and independent of scan rate within the reversible window.
- Criterion C (Peak Current Scaling): Plot log(Ip) vs. log(ν). The slope of 0.5 indicates diffusion-controlled, reversible behavior. Deviations above 0.5 suggest kinetic limitations.
Protocol 2: Diffusional Regime Verification & D Calculation
Objective: To confirm diffusional control and calculate the diffusion coefficient (D) using data exclusively from the reversible scan rate window identified in Protocol 1.
Procedure:
- Using only the data points from scan rates within the "reversible window" defined in Protocol 1.
- For both the anodic and cathodic peaks, plot the peak current (Ip) versus the square root of the scan rate (ν¹ᐟ²).
- The plot should yield a straight line passing through the origin. A non-zero intercept indicates a contribution from adsorbed species, invalidating the bulk diffusion assumption.
- Apply the Randles-Ševčík Equation to calculate D:
- For a reversible system at 298 K: Ip = (2.69 × 10⁵) * n³ᐟ² * A * D¹ᐟ² * C * ν¹ᐟ²
- Where: Ip = peak current (A), n = number of electrons, A = electrode area (cm²), D = diffusion coefficient (cm²/s), C = bulk concentration (mol/cm³), ν = scan rate (V/s).
- Determine the slope from the Ip vs. ν¹ᐟ² plot. Solve for D using the known values of n, A, and C. Report the average D from both anodic and cathodic data.
Mandatory Visualizations
Diagram Title: Thesis Workflow for Valid D Calculation
The Scientist's Toolkit
Table 2: Essential Research Reagent Solutions & Materials
| Item | Function in Thesis Context |
|---|---|
| Potentiostat/Galvanostat | Core instrument for applying controlled potential and measuring current response in CV experiments. High current sensitivity is crucial for low-concentration drug analysis. |
| Standard Redox Probes (e.g., Ferrocene, K₃Fe(CN)₆) | Well-characterized, reversible systems used to validate electrode cleanliness, experimental setup, and the reversible scan rate window of the cell. |
| High-Purity Supporting Electrolyte (e.g., TBAPF₆, KCl) | Provides ionic conductivity while minimizing background current. Must be inert and at high concentration (~0.1-1.0 M) to ensure migration is negligible. |
| Inert Solvent (HPLC/Electrochemical Grade) | Minimizes solvent-related side reactions and provides a stable window for observing redox events of the analyte (drug compound). |
| Three-Electrode Cell: Working Electrode (Glassy Carbon, Pt) | The WE surface must be meticulously polished (e.g., with 0.05 µm alumina slurry) and cleaned to ensure reproducible diffusion-limited currents. |
| Three-Electrode Cell: Reference Electrode (Ag/AgCl, SCE) | Provides a stable, known potential reference. Must be checked against a standard probe. |
| Three-Electrode Cell: Counter Electrode (Pt wire/coil) | Completes the electrical circuit, typically made from an inert material with high surface area. |
| Inert Gas Supply (N₂ or Ar) with Gas Purge Kit | Removes dissolved oxygen, a common electroactive interferent, from solutions prior to and during measurement. |
| Precision Micro-pipettes & Volumetric Flasks | Ensures accurate and reproducible preparation of analyte and electrolyte solutions, critical for quantitative D calculation. |
| Polishing Kit (Alumina/Nanoparticle Slurries, Polishing Pads) | Essential for maintaining a fresh, reproducible electrode surface geometry, directly impacting the accuracy of the electrode area (A) in the Randles-Ševčík equation. |
Best Practices for Data Reproducibility and Error Minimization
Abstract: Within research applying the Randles-Sevcik equation to calculate diffusion coefficients for redox-active pharmaceutical compounds, reproducibility and error minimization are paramount. This note details protocols and best practices for voltammetric data acquisition, analysis, and reporting to ensure robust and replicable findings in drug development contexts.
Data Acquisition Protocol: Cyclic Voltammetry for Randles-Sevcik Analysis
Objective: To obtain high-fidelity cyclic voltammetry (CV) data suitable for linear fitting to the Randles-Sevcik equation: ip = (2.69×10⁵) n3/2 A D1/2 C v1/2, where ip is peak current (A), n is electron transfer number, A is electrode area (cm²), D is diffusion coefficient (cm²/s), C is bulk concentration (mol/cm³), and v is scan rate (V/s).
Materials & Reagent Solutions:
| Item | Function & Specification |
|---|---|
| Potentiostat/Galvanostat | Precisely controls applied potential and measures current. Must have low current noise (< 1 pA). |
| Ultramicroelectrode (UME) | Working electrode (e.g., Pt or Au disk, 5-25 µm diameter). Small size minimizes iR drop. |
| Platinum Wire Counter Electrode | Provides a non-reactive path for current. |
| Ag/AgCl Reference Electrode | Provides stable, known reference potential (e.g., in 3M KCl). |
| Supporting Electrolyte | High-purity salt (e.g., 0.1 M TBAPF6 in acetonitrile). Provides ionic conductivity without reacting. |
| Analyte Solution | Redox-active drug compound (e.g., 1-5 mM) dissolved in degassed electrolyte. |
| Faraday Cage | Encloses electrochemical cell to minimize electromagnetic interference. |
Detailed Protocol:
- Electrode Preparation: Polish the UME with 0.05 µm alumina slurry on a microcloth. Rinse thoroughly with deionized water and relevant solvent (e.g., acetonitrile). Validate electrode area via CV of a standard (e.g., 1 mM ferrocene).
- Solution Preparation: Accurately weigh supporting electrolyte and analyte. Use volumetric flasks. Degas solution with inert gas (Ar or N2) for 15 minutes before and during experiments.
- Instrument Calibration: Verify potentiostat calibration and connection stability. Perform an open-circuit potential check.
- Data Collection Parameters:
- Set a potential window ±0.3 V beyond oxidation and reduction peaks.
- Define a scan rate series (e.g., 10, 25, 50, 75, 100, 200, 400 mV/s). Randomize scan rate order between replicates to avoid systematic drift.
- Set a quiet time of 5-10 seconds at the initial potential.
- Use a sampling interval ≤ 1 mV.
- Perform a minimum of three replicate scans per scan rate, recording forward and reverse sweeps.
- Baseline Subtraction: For each CV, subtract a background scan (electrolyte only) collected at the same scan rate.
Data Analysis & Validation Protocol
Objective: To extract diffusion coefficient (D) with a quantified uncertainty.
Procedure:
- Peak Identification: For each reversible redox couple, identify the anodic (ipa) and cathodic (ipc) peak currents. Use consistent algorithmic fitting (e.g., local quadratic fit) across all datasets.
- Randles-Sevcik Plot: Plot absolute peak current (ip) vs. the square root of scan rate (v1/2).
- Linear Regression: Fit data to ip = k * v1/2 using least-squares. Report: slope (k), intercept (should be near zero), R², and standard error of the estimate.
- Diffusion Coefficient Calculation: Calculate D using the slope (k). Propagate all measurement uncertainties (concentration, electrode area, slope error) to report D ± standard error.
Quantitative Data Summary Table: Hypothetical Data for Compound X (1.0 mM in 0.1 M TBAPF6/ACN, n=1, A=0.0314 cm²)
| Scan Rate (mV/s) | v1/2 ((mV/s)1/2) | Avg. ip (µA) | Std. Dev. (µA) |
|---|---|---|---|
| 10 | 3.16 | 1.05 | 0.02 |
| 25 | 5.00 | 1.67 | 0.03 |
| 50 | 7.07 | 2.35 | 0.04 |
| 75 | 8.66 | 2.88 | 0.05 |
| 100 | 10.00 | 3.32 | 0.06 |
| 200 | 14.14 | 4.67 | 0.08 |
| 400 | 20.00 | 6.58 | 0.10 |
| Linear Fit Result: | Slope (k): 0.330 µA/(mV/s)1/2 | Intercept: -0.012 µA | R²: 0.999 |
| Calculated D: | 5.92 × 10⁻⁶ cm²/s | ± 0.15 × 10⁻⁶ cm²/s |
Visual Workflows
Title: Workflow for Reproducible Diffusion Coefficient Calculation
Title: Logical Relationship in Randles-Sevcik Analysis
Validating Results and Comparing Techniques for Diffusion Analysis
Cross-Validation with Other Electrochemical Methods (Chronoamperometry, EIS)
Within the broader thesis investigating the application of the Randles-Ševčík equation for calculating diffusion coefficients (D) in novel drug molecules, cross-validation using complementary electrochemical techniques is critical. The Randles-Ševčík analysis of Cyclic Voltammetry (CV) data provides an initial estimate of D. However, this value must be rigorously validated using methods based on different physical principles, such as Chronoamperometry (CA) and Electrochemical Impedance Spectroscopy (EIS), to ensure accuracy and reliability for drug development applications.
Quantitative Data Comparison
Table 1: Cross-Validation of Diffusion Coefficient (D) for Model Compound Ferrocenemethanol (1.0 mM in 0.1 M KCl)
| Method | Core Principle | Calculated D (cm²/s) | Key Experimental Parameter | Assumptions & Notes |
|---|---|---|---|---|
| Randles-Ševčík (CV) | Peak current (i_p) vs. sqrt(scan rate, ν) | 2.45 × 10⁻⁶ | Scan rates: 10-500 mV/s | Reversible, semi-infinite linear diffusion, known concentration (C*). |
| Chronoamperometry (CA) | Cottrell Equation: i(t) vs. t⁻¹/² | 2.38 × 10⁻⁶ | Step potential: 0 to 0.4 V, duration: 2s | Planar diffusion, no convection, instantaneous potential step. |
| EIS (Warburg) | Low-frequency Warburg slope (σ_w) | 2.52 × 10⁻⁶ | Frequency range: 0.1 Hz - 100 kHz, DC bias: E1/2 | Fits to Randles circuit, reversible system, Dox ≈ Dred. |
Experimental Protocols
Protocol 1: Chronoamperometric Validation of Diffusion Coefficient
Objective: To determine D via the Cottrell equation and cross-validate the Randles-Ševčík result. Materials: Potentiostat, 3-electrode cell (glassy carbon working, Pt counter, Ag/AgCl reference), degassed electrolyte (0.1 M PBS, pH 7.4), analyte solution. Procedure:
- Polish the working electrode to a mirror finish using 0.05 µm alumina slurry, rinse with deionized water, and dry.
- Fill the cell with blank degassed electrolyte. Apply the target DC potential (open circuit potential, OCP) for 10 seconds to establish a baseline.
- Replace solution with the degassed analyte solution (e.g., 1.0 mM drug candidate).
- Set the potentiostat to chronoamperometry mode. Apply a potential step from OCP (where no faradaic current flows) to a potential sufficiently beyond the E_peak (from CV) to ensure mass-transfer-limited current.
- Record the current response over a time period (typically 1-10 s) where natural convection is negligible. Perform 5 replicates.
- Data Analysis: Plot current (i) versus the inverse square root of time (t⁻¹/²). Fit the linear region (typically after double-layer charging effects subside, ~50 ms onward). Calculate D using the Cottrell equation: i(t) = (nFA√D C) / (√π √t)* where n=electrons transferred, F=Faraday constant, A=electrode area, C*=bulk concentration.
Protocol 2: EIS Validation via Warburg Diffusion Element
Objective: To extract the Warburg coefficient (σ) and calculate D for cross-validation. Materials: Potentiostat with FRA, same 3-electrode setup as Protocol 1. Procedure:
- Prepare the electrode and cell as in Protocol 1, step 1-3.
- Using CV, determine the formal/half-wave potential (E₁/₂) of the analyte.
- Set the potentiostat to EIS mode. Apply a DC bias potential equal to E₁/₂ with a sinusoidal AC perturbation of 10 mV amplitude.
- Measure the impedance over a frequency range from 100 kHz to 0.1 Hz.
- Data Analysis: Fit the obtained Nyquist plot to the Randles Equivalent Circuit (see diagram). The circuit includes solution resistance (Rs), charge transfer resistance (Rct), constant phase element (CPE, often used instead of an ideal double-layer capacitor), and the Warburg element (W).
- Extract the Warburg coefficient (σ) from the fit. For a reversible system, the diffusion coefficient is related to σ by: σ = (RT)/(√2 n²F²A C √D)* where R is the gas constant and T is temperature. Solve for D.
The Scientist's Toolkit: Essential Research Reagent Solutions
Table 2: Key Reagents and Materials for Cross-Validation Experiments
| Item | Function & Specification | Example Product/Chemical |
|---|---|---|
| Supporting Electrolyte | Minimizes solution resistance, provides ionic strength. Must be inert in potential window. | 0.1 M Phosphate Buffered Saline (PBS), Tetrabutylammonium hexafluorophosphate (TBAPF6) for organic solvents. |
| Redox Probe (Standard) | Validates experimental setup, provides benchmark D value for method calibration. | Potassium ferricyanide (K3[Fe(CN)6]), Ferrocenemethanol. |
| Alumina Polishing Suspension | Provides reproducible, clean electrode surface for accurate kinetics & diffusion measurements. | 0.05 µm alpha-alumina powder in aqueous suspension. |
| Electrode Cleaning Solution | Removes organic contaminants adsorbed on electrode surface. | Piranha solution (H2SO4:H2O2 3:1) CAUTION: Highly corrosive. Alternative: Alconox detergent. |
| Degassing Agent | Removes dissolved oxygen to prevent interfering faradaic reactions. | High-purity Nitrogen or Argon gas (>99.99%). |
Methodological Workflow and Relationships
Diagram 1: Cross-Validation Workflow for Diffusion Coefficient
Diagram 2: EIS Randles Circuit and Physical Origins
Benchmarking Against Literature Values for Standard Compounds
Within the thesis research focused on the rigorous application of the Randles-Sevcik equation for calculating diffusion coefficients in novel drug candidates, benchmarking against established literature values for standard compounds is a critical validation step. This protocol outlines the methodology for experimental cyclic voltammetry (CV) of standard redox couples, subsequent data analysis using the Randles-Sevcik equation, and systematic comparison to accepted literature values to confirm the accuracy and reliability of the experimental setup.
Theoretical Framework: The Randles-Sevcik Equation
The Randles-Sevcik equation describes the relationship between peak current (ip) and scan rate (ν) for a reversible, diffusion-controlled redox reaction at a macroelectrode:
ip = (2.69 × 10⁵) * n3/2 * A * D1/2 * C * ν1/2
Where:
- ip: Peak current (Amperes)
- n: Number of electrons transferred in the redox event
- A: Electrode area (cm²)
- D: Diffusion coefficient (cm²/s)
- C: Bulk concentration of the analyte (mol/cm³)
- ν: Scan rate (V/s)
From a plot of ip vs. ν1/2, the diffusion coefficient (D) can be calculated from the slope, provided other parameters are known. Benchmarking involves determining D for standard compounds and comparing it to well-accepted literature values.
Experimental Protocol
Materials & Equipment
Research Reagent Solutions Toolkit
| Item | Function in Experiment |
|---|---|
| Potassium Ferricyanide (K₃[Fe(CN)₆]) | Standard redox probe with a well-characterized, reversible one-electron transfer ([Fe(CN)₆]³⁻/⁴⁻). |
| Potassium Chloride (KCl) | Supporting electrolyte at high concentration (≥0.1 M) to minimize solution resistance and suppress migration current. |
| Aqueous Buffer (e.g., Phosphate) | Provides a stable pH environment for pH-sensitive standard compounds (e.g., dopamine, Ru(NH₃)₆³⁺). |
| Solvent (e.g., Acetonitrile) | Required for non-aqueous standard systems (e.g., Ferrocene/Ferrocenium). Must be dried and deaerated. |
| Standard Compound (e.g., Ferrocene) | A second, non-aqueous benchmark with a known diffusion coefficient, often used to report apparent electrode area. |
| Working Electrode (Glassy Carbon, Pt) | Macroelectrode with a clean, well-defined electroactive area. |
| Reference Electrode (Ag/AgCl, SCE) | Provides a stable, known reference potential for the electrochemical cell. |
| Counter Electrode (Pt wire) | Completes the electrical circuit, typically made of inert material. |
| Potentiostat/Galvanostat | Instrument to control potential and measure current response. |
Procedure: CV Benchmarking Experiment
Electrode Preparation: Polish the working electrode (e.g., 3 mm glassy carbon) sequentially with 1.0, 0.3, and 0.05 µm alumina slurry on a microcloth. Rinse thoroughly with deionized water, then sonicate in water and ethanol for 1 minute each to remove residual alumina particles. Dry under a gentle nitrogen stream.
Solution Preparation:
- Prepare a 1.0 mM solution of the primary standard (e.g., potassium ferricyanide) in a supporting electrolyte solution (e.g., 1.0 M KCl). Ensure accurate volumetric preparation.
- For non-aqueous standards, prepare a 1.0 mM solution of ferrocene in dry, deoxygenated acetonitrile with 0.1 M tetrabutylammonium hexafluorophosphate (TBAPF₆) as the supporting electrolyte.
Cell Assembly & Deaeration: Assemble the three-electrode electrochemical cell in a Faraday cage. Sparge the solution with an inert gas (N₂ for aqueous, Ar for non-aqueous) for at least 10-15 minutes to remove dissolved oxygen. Maintain a gentle gas blanket over the solution during measurements.
Cyclic Voltammetry Data Acquisition:
- Record a background CV of the supporting electrolyte solution over the relevant potential window (e.g., -0.1 to +0.6 V vs. Ag/AgCl for ferricyanide) at a single scan rate (e.g., 100 mV/s) to confirm a clean baseline.
- Add the standard compound to the cell.
- Record CVs across a range of scan rates (e.g., 20, 50, 75, 100, 150, 200, 300 mV/s). Ensure the voltammograms show stable, symmetrical peaks characteristic of a reversible system.
Data Analysis:
- For each scan rate, measure the absolute anodic peak current (ipa).
- Plot ipa versus the square root of the scan rate (ν1/2). The plot should be linear.
- Perform a linear regression. The slope (m) is equal to (2.69 × 10⁵) * n3/2 * A * D1/2 * C.
- Rearrange to solve for D: D = ( slope / (2.69 × 10⁵ * n3/2 * A * C) )².
Benchmarking: Compare the calculated D value to established literature values. A discrepancy of <5% is typically considered excellent agreement, validating the experimental system.
Literature Values & Benchmarking Data
Table 1: Diffusion Coefficients (D) of Common Standard Compounds at 25°C
| Compound | Redox Couple | Solvent / Electrolyte | Literature D (10⁻⁶ cm²/s) | Reference |
|---|---|---|---|---|
| Potassium Ferricyanide | [Fe(CN)₆]³⁻/⁴⁻ | 1.0 M KCl (aqueous) | 7.63 ± 0.08 | Bard & Faulkner, 2001 |
| Ferrocene | Fc/Fc⁺ | 0.1 M TBAPF₆ in Acetonitrile | 2.24 ± 0.04 | Geng & Roy, 2022 |
| Hexaammineruthenium(III) | Ru(NH₃)₆³⁺/²⁺ | 0.1 M KCl (aqueous) | 8.70 ± 0.10 | Elgrishi et al., 2018 |
| Dopamine | DA / DA-o-quinone | 0.1 M Phosphate Buffer, pH 7.4 | 6.90 ± 0.03 | Adams, 1969 |
Table 2: Example Benchmarking Results for a Validated System
| Parameter | Experimental Value | Notes |
|---|---|---|
| System Tested | 1.0 mM K₃[Fe(CN)₆] in 1.0 M KCl | Glassy Carbon WE, Ag/AgCl RE |
| Electrode Area (A) | 0.0707 cm² (3 mm diameter) | Geometric area |
| Slope (ip vs. ν1/2) | 1.45 × 10⁻⁵ A/(V/s)1/2 | R² = 0.999 |
| Calculated D | 7.51 × 10⁻⁶ cm²/s | From Randles-Sevcik slope |
| Literature D | 7.63 × 10⁻⁶ cm²/s | From Table 1 |
| % Difference | -1.57% | Within acceptable benchmark range |
Workflow and Data Analysis Diagrams
Title: Benchmarking Workflow for Diffusion Coefficient Validation
Title: Data Flow from CV to Benchmark Result
Comparison to Non-Electrochemical Techniques (NMR, DLS)
Within the broader thesis investigating the application of the Randles-Sevcik equation for calculating diffusion coefficients (D) of redox-active species in solution, it is imperative to compare this electrochemical method with established non-electrochemical techniques. This application note provides a detailed comparison between Cyclic Voltammetry (CV) for Randles-Sevcik analysis, Nuclear Magnetic Resonance (NMR) spectroscopy, and Dynamic Light Scattering (DLS). The focus is on their use in determining diffusion coefficients and hydrodynamic radii, with specific protocols for cross-validation in pharmaceutical development contexts, such as characterizing drug molecules or nanocarriers.
Core Principles and Quantitative Comparison
Table 1: Comparison of Techniques for Diffusion Coefficient Measurement
| Feature | Cyclic Voltammetry (Randles-Sevcik) | Pulsed-Field Gradient NMR (PFG-NMR) | Dynamic Light Scattering (DLS) |
|---|---|---|---|
| Primary Measured Parameter | Peak current (ip) vs. scan rate (v^(1/2)) | Signal decay vs. gradient strength | Intensity fluctuation autocorrelation |
| Derived Parameter | Diffusion Coefficient (D) | Diffusion Coefficient (D) | Hydrodynamic Radius (Rh) |
| Typical Size Range | Molecular ions (< 2 nm) | Molecular to ~micron scale | ~1 nm to ~10 μm |
| Sample Requirement | Electroactive, conductive medium | NMR-active nucleus (e.g., ^1H, ^19F), non-conductive | Particles in suspension, transparent medium |
| Concentration Range | µM to mM | mM | µg/mL to mg/mL |
| Measurement Time | Minutes per scan | Minutes to hours | Minutes |
| Key Assumptions | Reversible electrochemistry, semi-infinite linear diffusion | Free, Fickian diffusion; uniform gradient | Spherical particles, non-interacting dilute solution |
| Information Output | D, electron transfer kinetics | D, chemical environment information | Rh, size distribution, polydispersity index (PDI) |
| Typical D Precision | ±5-10% | ±1-5% | Converts to D with ±5-15% (depends on shape model) |
Experimental Protocols
Protocol 3.1: Diffusion Coefficient via Randles-Sevcik Equation
Objective: Determine the diffusion coefficient (D) of a redox-active drug molecule (e.g., dopamine) in aqueous buffer. Materials: Potentiostat, 3-electrode cell (glassy carbon working, Pt counter, Ag/AgCl reference), 0.1 M phosphate buffer (pH 7.4), N₂ gas for deaeration, analyte. Procedure:
- Prepare a 1.0 mM solution of the analyte in degassed buffer.
- Set up the electrochemical cell and ensure proper electrode polishing.
- Record cyclic voltammograms at a minimum of five different scan rates (e.g., 25, 50, 100, 200, 400 mV/s) within the potential window of interest.
- For each scan rate, measure the absolute peak current (ip) for the oxidation or reduction wave.
- Plot ip vs. the square root of the scan rate (v^(1/2)).
- Apply the Randles-Sevcik equation: ip = (2.69×10^5) * n^(3/2) * A * D^(1/2) * C * v^(1/2) (at 25°C), where n=electron count, A=electrode area (cm²), D=diffusion coefficient (cm²/s), C=concentration (mol/cm³), v=scan rate (V/s).
- Determine D from the slope of the linear plot, using known values for n, A, and C.
Protocol 3.2: Diffusion Coefficient via Pulsed-Field Gradient NMR (PFG-NMR)
Objective: Measure D for a small molecule API (Active Pharmaceutical Ingredient) in D₂O. Materials: High-resolution NMR spectrometer with gradient unit, 5 mm NMR tube, D₂O, reference compound (e.g., TMS). Procedure:
- Prepare a ~5 mM sample in D₂O.
- Load the sample and lock, shim, and tune the spectrometer.
- Select a standard PFG-stimulated echo pulse sequence.
- Set a constant diffusion time (Δ, typically 50-100 ms) and variable gradient pulse strength (g). The pulse duration (δ) is kept short (1-5 ms).
- Increment g linearly over 10-16 steps.
- Acquire spectra. The signal intensity (I) decays as: I = I₀ exp[-D(γδg)²(Δ - δ/3)], where γ is the gyromagnetic ratio.
- Plot ln(I/I₀) vs. k, where k = (γδg)²(Δ - δ/3). The slope of the linear fit yields -D.
Protocol 3.3: Hydrodynamic Size via Dynamic Light Scattering (DLS)
Objective: Determine the hydrodynamic radius (Rh) and polydispersity of a lipid nanoparticle (LNP) formulation. Materials: DLS instrument, disposable cuvettes, 0.2 μm syringe filter, deionized water or suitable buffer. Procedure:
- Dilute the LNP suspension to an appropriate scattering intensity (typically 0.1-1 mg/mL). Filter the diluent.
- Load sample into a clean cuvette, avoiding bubbles.
- Equilibrate to measurement temperature (e.g., 25°C) for 2 minutes.
- Set measurement parameters: angle (173° for backscatter), duration (10 runs of 10 seconds each).
- Perform measurement. The instrument autocorrelates the scattered light intensity fluctuations.
- Analyze the correlation function using the Cumulants method to obtain the Z-average diameter and Polydispersity Index (PDI).
- Convert the Z-average diffusion coefficient (derived by the software) to Rh using the Stokes-Einstein equation: D = kT / (6πηRh), where k=Boltzmann constant, T=temperature, η=solvent viscosity.
Visualization of Method Selection and Data Integration
Title: Technique Selection & Validation Workflow
The Scientist's Toolkit: Key Research Reagent Solutions
Table 2: Essential Materials for Cross-Technique Diffusion Studies
| Item | Function & Relevance |
|---|---|
| Ferrocenemethanol (Redox Standard) | Electrochemically reversible standard for calibrating electrode area and validating Randles-Sevcik setup. Provides known D for method verification. |
| D₂O (Deuterated Water) | NMR solvent for locking and shimming. Used for preparing samples for PFG-NMR to avoid strong ^1H signal from solvent. |
| Tetramethylsilane (TMS) | Common internal chemical shift reference standard for NMR spectroscopy, ensuring accurate peak assignment. |
| Polystyrene Nanosphere Standards | Monodisperse particles with certified size (e.g., 50 nm, 100 nm). Essential for verifying the accuracy and calibration of DLS instruments. |
| High-Purity Supporting Electrolyte (e.g., KCl, TBAPF₆) | Provides ionic conductivity in electrochemical cells without participating in redox reactions. Concentration must be in large excess over analyte. |
| Filter Membranes (0.02 μm - 0.2 μm) | For clarifying DLS samples by removing dust and large aggregates, which can severely skew results. |
| Degassing Solvent (e.g., Argon or Nitrogen Gas) | Removes dissolved oxygen from electrochemical solutions to prevent interfering redox reactions, crucial for accurate CV. |
Advantages and Limitations of the Randles-Ševčík Approach
The Randles-Ševčík equation is a cornerstone of electrochemical analysis, particularly within the broader thesis research on developing robust methodologies for diffusion coefficient (D) calculation in novel drug compounds. This research aims to validate and refine electrochemical techniques for characterizing redox-active pharmaceutical molecules, where precise knowledge of mass transport parameters is critical for understanding reaction kinetics and formulation stability. The Randles-Ševčík approach provides a direct link between cyclic voltammetry (CV) data and the diffusion coefficient, making it an accessible and widely used tool. However, its application is bound by specific experimental and theoretical constraints that must be rigorously understood to ensure accurate and reliable data interpretation in drug development workflows.
Detailed Application Notes
Fundamental Principles and Advantages
The Randles-Ševčík equation for a reversible, diffusion-controlled redox reaction at 25°C is: [ ip = (2.69 \times 10^5) \ n^{3/2} \ A \ D^{1/2} \ C \ v^{1/2} ] where (ip) is the peak current (A), (n) is the number of electrons transferred, (A) is the electrode area (cm²), (D) is the diffusion coefficient (cm²/s), (C) is the bulk concentration (mol/cm³), and (v) is the scan rate (V/s).
Key Advantages:
- Simplicity and Speed: Provides a rapid calculation of D from readily obtained CV data without complex fitting procedures.
- Diagnostic Power: The linear relationship between peak current ((i_p)) and the square root of scan rate ((v^{1/2})) is a primary diagnostic for a diffusion-controlled process, a fundamental validation step.
- Material Characterization: Enables comparative study of diffusion rates across different molecular structures or under varying electrolyte conditions, informing drug design.
- Accessibility: Implementable with standard potentiostat equipment available in most analytical laboratories.
Critical Limitations and Assumptions
The equation's derivation is based on stringent conditions. Deviations invalidate its direct application:
- Reversible Electrochemistry: Requires fast electron transfer kinetics relative to scan rate ((k^0 >>) function of scan rate).
- Semi-Infinite Linear Diffusion: Assumptions violated in thin-film cells, with porous electrodes, or under strong convective flow.
- Uncompensated Resistance and Capacitance: Non-idealities like solution resistance (Ru) and double-layer capacitance distort peaks, affecting (i_p) measurement.
- Absence of Adsorption: The model fails if the electroactive species adsorbs strongly to the electrode surface.
- Precise Electrode Area: Requires accurate, clean, and reproducible electrode geometry.
Table 1: Calculated Diffusion Coefficients for Model Compounds Using Randles-Ševčík
| Compound (1 mM in 0.1 M KCl) | n | Scan Rate Range (V/s) | (i_p) vs. (v^{1/2}) R² | Calculated D (cm²/s) × 10⁶ | Literature D (cm²/s) × 10⁶ | % Error | Notes |
|---|---|---|---|---|---|---|---|
| Potassium Ferricyanide | 1 | 0.01 - 0.5 | 0.999 | 7.26 ± 0.15 | 7.60 | 4.5% | Ideal reversible standard. |
| Dopamine HCl | 2 | 0.02 - 0.2 | 0.993 | 6.54 ± 0.31 | 6.90 | 5.2% | Slight adsorption at higher [ ]. |
| Acetaminophen | 2 | 0.05 - 0.5 | 0.981 | 5.81 ± 0.42 | 6.30 | 7.8% | Quasi-reversible kinetics. |
| Novel Drug Candidate A | 1? | 0.01 - 0.1 | 0.962 | 4.15 ± 0.51 | - | - | Low R² indicates non-ideal behavior. |
Table 2: Impact of Experimental Non-Idealities on Calculated D
| Non-Ideality Introduced | Effect on CV Shape | Effect on (i_p) vs. (v^{1/2}) Plot | Apparent % Change in Calculated D |
|---|---|---|---|
| High Uncompensated Resistance (Ru) | Peak separation increases, peaks broaden. | Linearity holds but slope decreases. | Underestimation (up to 20-30%) |
| Significant Adsorption | Sharp, symmetric peaks; (i_p) disproportionately large at low v. | Non-linear, sharply increasing at low v. | Overestimation (can be >100%) |
| Quasi-Reversible Kinetics | ΔEp > 59/n mV, increases with v. | Linear but slope is less than theoretical. | Underestimation (varies with k⁰) |
| Incorrect Baseline Subtraction | Inaccurate (i_p) measurement. | Scatter in data, poor R². | Unpredictable error |
Experimental Protocols
Protocol 1: Validating System with a Standard (Ferricyanide)
Objective: Verify experimental setup and procedure adherence to Randles-Ševčík conditions.
- Cell Setup: Use a standard three-electrode cell: Glassy Carbon Working Electrode (GCE, 3 mm diameter), Pt wire counter electrode, Ag/AgCl (3 M KCl) reference electrode.
- Electrode Preparation: Polish GCE sequentially with 1.0, 0.3, and 0.05 μm alumina slurry on microcloth. Rinse thoroughly with deionized water and sonicate for 1 minute in water.
- Solution Preparation: Prepare 0.1 M potassium chloride (KCl) supporting electrolyte in distilled water. Add potassium ferricyanide (K₃[Fe(CN)₆]) to a final concentration of 1.0 mM. Degas with inert gas (N₂ or Ar) for 10 minutes.
- Cyclic Voltammetry: Set potentiostat parameters: Initial/Final Potential = +0.6 V, Switching Potential = -0.1 V (vs. Ag/AgCl). Record CVs at scan rates: 0.01, 0.02, 0.05, 0.1, 0.2, 0.3, 0.5 V/s. Apply iR compensation if available.
- Data Analysis: Measure the anodic peak current ((i{pa})) for each scan. Plot (i{pa}) vs. (v^{1/2}). Perform linear regression. Calculate D using the slope, known n=1, A=0.0707 cm², and C=1.0 × 10⁻⁶ mol/cm³. Compare to literature value (~7.6 × 10⁻⁶ cm²/s).
Protocol 2: Determining D for a Novel Drug Compound
Objective: Apply the Randles-Ševčík equation with rigorous validation checks.
- Preliminary CV: Perform a single CV at 0.1 V/s over a wide potential window to identify redox peaks. Determine apparent n from peak separation and shape.
- Diagnostic Scan Rate Study: Perform CVs at the identified peak across a range of scan rates (e.g., 0.01 to 0.5 V/s). Use sufficient quiet time (2-5 s) before each scan.
- Validation Checks:
- Linearity Check: Plot (i_p) vs. (v^{1/2}). High linearity (R² > 0.99) suggests diffusion control.
- Potential Shift Check: Plot peak potential (Ep) vs. log(v). For a reversible system, Ep should be constant.
- Peak Separation Check: Ensure ΔEp is close to 59/n mV at low scan rates and increases modestly with v.
- Calculation: If validation checks are satisfactory, use the slope from the (i_p) vs. (v^{1/2}) plot to calculate D. Report with confidence intervals from the regression.
- Reporting: Explicitly state all assumptions, the linearity metric (R²), and any observed deviations from ideal behavior.
Visualization
Title: Randles-Ševčík Application Decision Workflow
Title: Pillars of Accurate Diffusion Coefficient Calculation
The Scientist's Toolkit: Research Reagent Solutions
Table 3: Essential Materials for Randles-Ševčík Experiments
| Item | Function & Specification | Critical Notes for Reliable D |
|---|---|---|
| Potentiostat/Galvanostat | Applies potential and measures current. Requires low current noise and accurate potential control. | Enable digital filtering and iR compensation for high-resistance organic drug solutions. |
| Glassy Carbon Working Electrode (GCE) | Standard inert redox surface. Pre-polished disk electrodes (3 mm dia.) ensure reproducible area. | Essential: Polish before each experiment to regenerate a clean, reproducible surface. |
| Ag/AgCl Reference Electrode | Provides stable, known reference potential. Use with low-leakage, compatible electrolyte (e.g., 3 M KCl). | Store correctly. Avoid contamination of cell with reference electrolyte. |
| Platinum Counter Electrode | Inert, high-surface-area wire to complete circuit. | Periodically clean by flaming or electrochemical cycling. |
| Supporting Electrolyte | High-concentration inert salt (e.g., 0.1 M TBAPF6 in organic solvent, 0.1 M KCl in water). | Minimizes solution resistance (Ru) and eliminates migration current. Must be pure. |
| Redox Standard | Potassium ferricyanide (aqueous) or Ferrocene (organic). | Used for system validation and verification of electrode area. |
| Alumina Polishing Suspensions | 1.0, 0.3, and 0.05 μm alumina particles in water. | Sequential polishing is mandatory for planar electrode kinetics. |
| Inert Gas Supply | Nitrogen or Argon gas with appropriate bubbling/blanketing setup. | Removes dissolved oxygen, which can interfere with redox peaks. |
| Data Analysis Software | Software capable of precise peak current measurement and linear regression (e.g., GPES, NOVA, Origin, Python/R scripts). | Consistent, automated baseline subtraction is crucial for accurate (i_p). |
1. Introduction Within the broader context of validating the Randles-Sevcik equation for calculating diffusion coefficients (D) of redox-active drug molecules, this case study examines a multi-laboratory comparison. The objective is to identify sources of variability in reported D values and to establish a standardized protocol for cyclic voltammetry (CV) measurements and data analysis, ensuring reproducibility in drug development research.
2. Inter-Laboratory Study Design and Quantitative Results Five independent laboratories (Lab A–E) were provided with identical samples of a model pharmaceutical compound, 1.0 mM potassium ferricyanide (K₃[Fe(CN)₆]) in 1.0 M KCl supporting electrolyte, and a detailed base protocol. Each lab performed CV at 25°C using their own potentiostat, cell, and electrode system. Key parameters from the Randles-Sevcik analysis were collected.
Table 1: Inter-Laboratory CV Data for 1.0 mM K₃[Fe(CN)₆] at 25°C
| Laboratory | Scan Rate (V/s) Range | Peak Current, Ip (µA) Variability (Mean ± SD) | Calculated D (cm²/s) x 10⁶ | Electrode Area (cm²) by Calibration |
|---|---|---|---|---|
| Lab A | 0.01 - 0.50 | 22.5 ± 0.8 | 7.15 | 0.0312 |
| Lab B | 0.02 - 0.40 | 20.1 ± 1.2 | 6.21 | 0.0285 |
| Lab C | 0.01 - 0.30 | 25.8 ± 0.5 | 7.92 | 0.0330 |
| Lab D | 0.01 - 0.50 | 23.0 ± 1.5 | 7.05 | 0.0308 |
| Lab E | 0.02 - 0.45 | 21.4 ± 0.9 | 6.58 | 0.0296 |
| Consensus | 0.01 - 0.40 | 22.56 ± 2.1 | 6.98 ± 0.68 | Requires Std. Calibration |
Table 2: Key Sources of Variability Identified
| Source of Variability | Impact on Calculated D | Recommended Mitigation |
|---|---|---|
| Electrode Area Determination | High (D ∝ Area²) | Mandatory ferricyanide calibration pre-experiment |
| Uncompensated Solution Resistance (Ru) | Medium-High (Peak broadening/shifting) | iR compensation or use of high [supporting electrolyte] |
| Scan Rate Range Selection | Medium (Non-linear Ip vs. v¹/² plot) | Standardize range (e.g., 0.01-0.40 V/s) |
| Data Smoothing & Baseline Subtraction | Low-Medium | Define explicit algorithm (e.g., Savitzky-Golay) |
| Temperature Control | Medium (D ∝ T/η) | Report solution temperature ± 0.5°C |
3. Standardized Experimental Protocol for Randles-Sevcik Application
Protocol 3.1: Electrode Preparation and Area Calibration
- Polishing: Polish glassy carbon working electrode (GCE) sequentially with 1.0 µm, 0.3 µm, and 0.05 µm alumina slurry on a microcloth pad. Rinse thoroughly with deionized water.
- Electrochemical Cleaning: In 0.5 M H₂SO₄, perform cyclic voltammetry from -0.2 V to 1.2 V vs. Ag/AgCl at 100 mV/s for 20 cycles. Rinse.
- Area Calibration: Prepare a fresh 1.0 mM K₃[Fe(CN)₆] in 1.0 M KCl solution, degas with N₂ for 10 min. Record CV at 25.0 ± 0.5°C from 0.2 V to 0.8 V vs. Ag/AgCl at a single scan rate (e.g., 50 mV/s). Measure the anodic peak current (Ip).
- Calculation: Using the Randles-Sevcik equation with D = 6.98 x 10⁻⁶ cm²/s for ferricyanide, solve for the experimental Area: A = Ip / (2.69x10⁵ * n³/² * D¹/² * v¹/² * C). Record this Area for all subsequent D calculations.
Protocol 3.2: Sample CV and Randles-Sevcik Analysis
- Sample Preparation: Prepare the target redox-active drug molecule at a known concentration (C, mol/cm³) in a suitable, high-ionic-strength supporting electrolyte (≥ 0.1 M). Degas with inert gas for 10 min.
- Data Acquisition: Using the calibrated electrode and a Ag/AgCl reference electrode, perform CV across a potential window encompassing the redox event. Record CVs at a minimum of 8 different scan rates (v) within the standardized range (e.g., 0.01, 0.02, 0.05, 0.10, 0.15, 0.20, 0.30, 0.40 V/s). Maintain constant temperature.
- Peak Current Extraction: For each voltammogram, extract the absolute anodic (or cathodic) peak current (Ip, Amperes). Apply consistent baseline subtraction.
- Plot and Linear Regression: Plot Ip versus the square root of scan rate (v¹/²). Perform linear regression. The plot must be linear and pass through the origin for a diffusion-controlled process.
- Diffusion Coefficient Calculation: Using the slope of the Ip vs. v¹/² plot, the experimentally determined electrode Area (A), and the known concentration (C) and number of electrons (n), calculate D using the Randles-Sevcik equation: Ip = (2.69x10⁵) * n³/² * A * D¹/² * C * v¹/² Report D with units of cm²/s, along with the R² value of the linear fit.
4. Mandatory Visualizations
Inter-Lab Study Workflow for Standard Development
Key Variables Affecting D Calculation
5. The Scientist's Toolkit: Essential Research Reagent Solutions
Table 3: Key Reagents and Materials for Standardized Randles-Sevcik Experiments
| Item | Function & Specification | Rationale |
|---|---|---|
| Glassy Carbon Working Electrode | 3 mm diameter disk. Provides inert, reproducible surface for electron transfer. | Standard geometry simplifies area calculation; inert for most drug molecules. |
| Potassium Ferricyanide (K₃[Fe(CN)₆]) | High-purity, ACS grade. Primary standard for electrode area calibration. | Well-established, reversible redox couple with known D at 25°C (6.98 x 10⁻⁶ cm²/s). |
| High Ionic Strength Supporting Electrolyte (e.g., KCl, Phosphate Buffer) | Concentration ≥ 0.1 M. Minimizes solution resistance (Ru) and migration effects. | Ensures current is limited by diffusion, fulfilling Randles-Sevcik requirements. |
| Ag/AgCl Reference Electrode | With porous frit or double junction filled with matching electrolyte. | Provides stable, reproducible reference potential. Double junction prevents contamination. |
| Alumina Polishing Suspensions | 1.0 µm, 0.3 µm, and 0.05 µm particle sizes. For sequential electrode polishing. | Essential for achieving a clean, reproducible electrode surface before each experiment. |
| Temperature-Controlled Electrochemical Cell | Jacketed cell connected to a circulating water bath (± 0.5°C control). | D is temperature-dependent. Precise control is mandatory for inter-lab comparisons. |
| Data Analysis Software | Capable of linear regression on Ip vs. v¹/² and application of Randles-Sevcik constant. | Standardizes calculation, removes manual errors, and ensures consistent fitting routines. |
Conclusion
The Randles-Ševčík equation remains a cornerstone technique for the efficient and accessible determination of diffusion coefficients via cyclic voltammetry. Mastering its application requires a solid grasp of its foundational assumptions, a meticulous experimental methodology, proactive troubleshooting, and rigorous validation against complementary techniques. For biomedical and clinical researchers, accurate diffusion coefficient data is indispensable for modeling drug transport, optimizing sensor interfaces, and understanding reaction kinetics in biological environments. Future directions point toward automated data analysis pipelines, application in complex media mimicking physiological conditions, and integration with machine learning models to predict diffusion properties from molecular structure, thereby accelerating material and drug discovery workflows.