CV vs EIS: A Comprehensive Guide to Electrochemical Kinetics Analysis for Biomedical Researchers
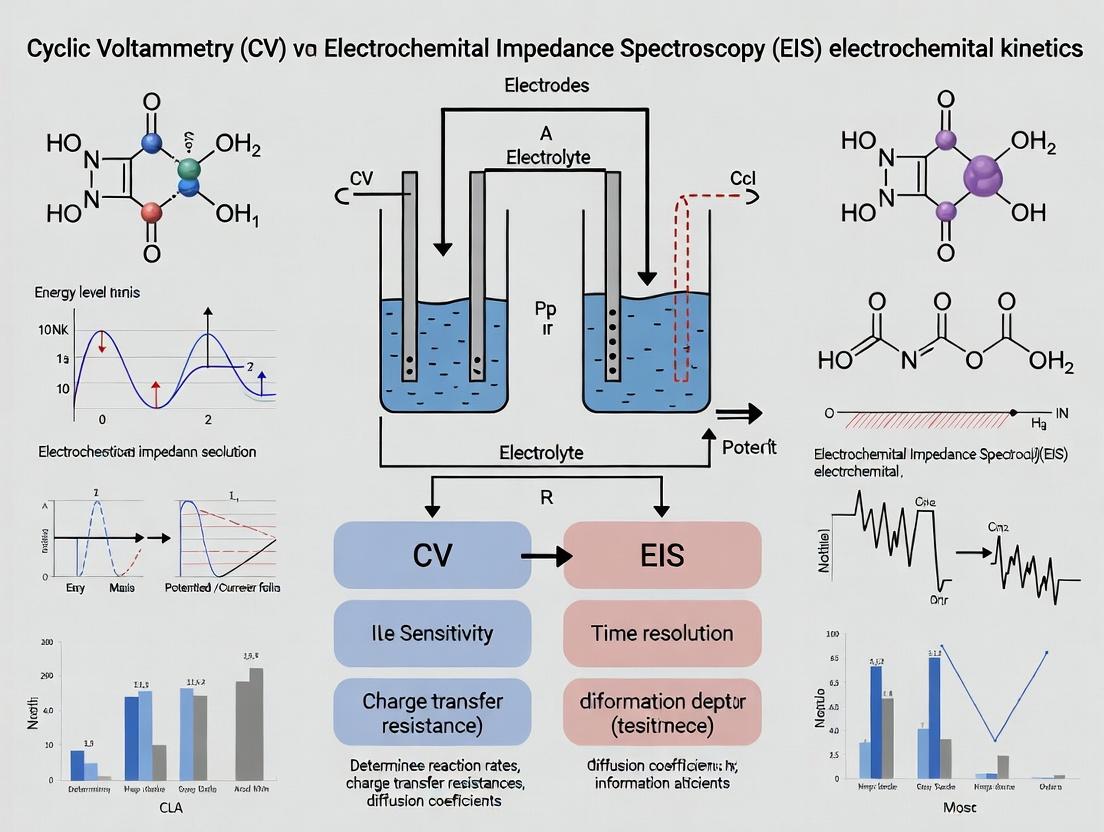
This article provides a detailed comparison of Cyclic Voltammetry (CV) and Electrochemical Impedance Spectroscopy (EIS) for investigating electrochemical kinetics, a critical aspect in biosensor development, drug delivery monitoring, and biomaterial...
CV vs EIS: A Comprehensive Guide to Electrochemical Kinetics Analysis for Biomedical Researchers
Abstract
This article provides a detailed comparison of Cyclic Voltammetry (CV) and Electrochemical Impedance Spectroscopy (EIS) for investigating electrochemical kinetics, a critical aspect in biosensor development, drug delivery monitoring, and biomaterial characterization. Targeting researchers and drug development professionals, it explores the fundamental principles of each technique, their practical applications in kinetic studies, common troubleshooting strategies, and a direct validation-based comparison. The guide synthesizes current methodologies to help scientists select the optimal technique for quantifying electron transfer rates, diffusion coefficients, and interfacial processes relevant to biomedical innovation.
Understanding the Core Principles: CV and EIS for Kinetic Analysis
Electrochemical rate constants (k⁰) quantify the intrinsic speed of electron transfer (ET) reactions at an electrode-electrolyte interface. In biomedicine, these constants are critical for understanding redox processes in biological systems, developing biosensors, screening drug metabolism, and designing implantable devices. The accurate determination of k⁰ is thus a central pursuit in bioelectrochemistry.
CV vs EIS for Electrochemical Kinetics: A Core Methodological Comparison
Two predominant techniques for quantifying kinetic parameters are Cyclic Voltammetry (CV) and Electrochemical Impedance Spectroscopy (EIS). This guide provides a comparative analysis within the context of biomedical research.
Experimental Protocols
Protocol 1: Cyclic Voltammetry for ET Rate Constant Determination
- System Setup: Utilize a standard three-electrode cell (working, reference, counter) with a known redox probe (e.g., 1 mM Potassium Ferricyanide in 1 M KCl).
- Data Acquisition: Record CV scans at varying scan rates (ν) from 10 mV/s to 1000 mV/s.
- Kinetic Analysis (Nicholson Method): For quasi-reversible systems, the peak separation (ΔEp) beyond 59 mV is used. Calculate the dimensionless parameter ψ, which relates ΔEp and ν. Use the Nicholson approximation: ψ = k⁰ / [πDnFν/(RT)]^(1/2), where D is the diffusion coefficient, n is electron number, F is Faraday's constant, R is the gas constant, and T is temperature. Interpolate ψ from standard tables using measured ΔEp to solve for k⁰.
Protocol 2: Electrochemical Impedance Spectroscopy for ET Rate Constant Determination
- System Setup: Use the same cell and redox probe as in CV. Apply the formal potential (E⁰) of the redox couple as the DC bias.
- Data Acquisition: Measure impedance over a frequency range (e.g., 100 kHz to 0.1 Hz) with a small AC perturbation (typically 10 mV RMS).
- Kinetic Analysis (Randles Circuit Fitting): Fit the obtained Nyquist plot to the Randles equivalent circuit (Solution Resistance Rs in series with a parallel combination of Charge Transfer Resistance Rct and Constant Phase Element CPE). The charge transfer resistance is directly related to the ET rate constant: k⁰ = RT/(nFARctC), where A is electrode area and C is the concentration of the redox species.
Performance Comparison Data
Table 1: Comparative Analysis of CV and EIS for Kinetic Studies
| Feature | Cyclic Voltammetry (CV) | Electrochemical Impedance Spectroscopy (EIS) |
|---|---|---|
| Primary Kinetic Output | Heterogeneous ET rate constant (k⁰) via ΔEp analysis. | Charge transfer resistance (Rct), converted to k⁰. |
| Ideal Kinetic Range | Best for moderate rates (10⁻¹ to 10⁻⁵ cm/s). Very fast (>0.1 cm/s) and very slow kinetics are challenging. | Excellent for quantifying slow to moderate ET rates (<10⁻² cm/s). |
| Impact of Diffusion | Inherently convolutes diffusion and kinetics. Requires scan rate studies to deconvolute. | Can be minimized by fitting with a Warburg element; effective separation at high frequency. |
| Probing Time Window | Millisecond to second range, controlled by scan rate. | Microsecond to kilosecond range, controlled by AC frequency. |
| Data Interpretation Complexity | Moderate. Relies on peak shapes and positions; simple reversible systems are straightforward. | High. Requires modeling with equivalent circuits; model choice is critical and sometimes ambiguous. |
| Suitability for Coated/Bio-Functionalized Electrodes | Can be obscured by non-Faradaic capacitive currents. Peak broadening can complicate analysis. | Highly effective. Can distinguish pore diffusion, film resistance, and interfacial ET separately. |
| Typical Experimental Time | Fast (minutes for a scan rate series). | Slower (several minutes to an hour for a full frequency spectrum). |
Table 2: Experimental k⁰ Values for a Model System (Ferricyanide on Gold)
| Method | Reported k⁰ (cm/s) | Experimental Conditions (Summarized) | Key Advantage for this Measurement |
|---|---|---|---|
| CV (Nicholson Fit) | 0.025 ± 0.005 | 1 mM K₃[Fe(CN)₆] in 1 M KCl, ν = 50-500 mV/s. | Rapid assessment of moderate kinetics. |
| EIS (Randles Fit) | 0.022 ± 0.003 | 1 mM K₃[Fe(CN)₆] in 1 M KCl, DC bias = +0.22 V vs. Ag/AgCl. | Direct measurement of interfacial charge transfer resistance. |
The Scientist's Toolkit: Key Research Reagent Solutions
Table 3: Essential Materials for Electrochemical Kinetic Studies in Biomedicine
| Item | Function & Relevance |
|---|---|
| Redox Probes (Ferri/Ferrocyanide, Ru(NH₃)₆³⁺/²⁺) | Well-characterized, outer-sphere redox couples for calibrating electrode kinetics and testing sensor platforms. |
| Phosphate Buffered Saline (PBS) & Biological Buffers | Provide physiologically relevant ionic strength and pH for studying biomolecules (proteins, DNA) and drug compounds. |
| Thiolated DNA or PEG Alkanethiols | Form self-assembled monolayers (SAMs) on gold electrodes to create well-defined, biocompatible interfaces for probing biomolecular ET or reducing fouling. |
| Enzymes (Glucose Oxidase, Cytochrome c) | Model redox proteins for studying direct electron transfer (DET) or mediated electron transfer (MET) kinetics, relevant to biosensor development. |
| Nafion Perfluorinated Polymer | A cation-exchange membrane coating used to entrap biomolecules on electrode surfaces and provide selectivity in complex biological media. |
Methodological Workflow & Data Relationship Diagrams
Diagram Title: CV Kinetics Analysis via Nicholson Method
Diagram Title: EIS Kinetics Analysis via Randles Model
Diagram Title: Decision Guide: Choosing CV or EIS for Kinetics
This comparison guide is framed within a broader research thesis comparing Cyclic Voltammetry (CV) and Electrochemical Impedance Spectroscopy (EIS) for elucidating electrochemical kinetics. A foundational relationship in CV analysis is that between the potential sweep rate (v) and the observed peak current (i_p). This guide objectively compares the diagnostic power of this relationship against the capabilities of EIS for determining charge transfer kinetics, supported by experimental data.
The Randles-Ševčík Equation: Core Theory
For a reversible, diffusion-controlled redox reaction, the peak current is directly proportional to the square root of the sweep rate. This is formalized by the Randles-Ševčík equation (at 25°C):
i_p = (2.69 × 10^5) * n^(3/2) * A * D^(1/2) * C * v^(1/2)
Where:
- i_p = peak current (A)
- n = number of electrons transferred
- A = electrode area (cm²)
- D = diffusion coefficient (cm²/s)
- C = bulk concentration (mol/cm³)
- v = sweep rate (V/s)
A plot of i_p vs. v^(1/2) yields a straight line, confirming diffusion control. Deviations from this linearity indicate complications such as adsorption, kinetic limitations, or capacitive effects.
CV Sweep Rate Analysis vs. EIS for Kinetics
The table below compares the two techniques for analyzing electrochemical kinetics.
Table 1: Technique Comparison for Kinetic Analysis
| Feature | CV Sweep Rate Analysis | Electrochemical Impedance Spectroscopy (EIS) |
|---|---|---|
| Primary Kinetic Output | Apparent standard rate constant (k⁰) from scan rate dependence. | Direct charge transfer resistance (R_ct), leading to k⁰. |
| Measurement Domain | Time domain (transient, non-steady state). | Frequency domain (steady-state or pseudo-steady-state). |
| Information on Diffusion | Excellent. Separates diffusion from kinetics via sweep rate studies. | Excellent. Warburg element quantifies diffusion. |
| Sensitivity to Fast Kinetics | Limited by available scan rates. IR drop can distort data at high v. | Can measure very fast kinetics with high-frequency data. |
| Data Fitting Complexity | Moderate. Uses non-linear regression of entire voltammogram or peak parameters. | High. Requires equivalent circuit modeling with validation. |
| Typical Experimental Time | Fast (minutes per experiment). | Slow (tens of minutes to hours per experiment). |
Supporting Experimental Data
A study investigating the ferro/ferricyanide redox couple ([Fe(CN)₆]³⁻/⁴⁻) on a glassy carbon electrode was performed to demonstrate the sweep rate relationship and compare extracted parameters with EIS.
Experimental Protocol 1: CV Sweep Rate Dependence
- Cell Setup: A standard three-electrode cell with a 3 mm diameter glassy carbon working electrode, Pt wire counter electrode, and Ag/AgCl (3M KCl) reference electrode.
- Solution: 5 mM K₃[Fe(CN)₆] in 1 M KCl supporting electrolyte, deaerated with N₂ for 10 minutes.
- Procedure: The working electrode was polished with 0.05 μm alumina slurry and rinsed. CVs were recorded from 0.1 to 1.0 V vs. Ag/AgCl at sweep rates from 25 to 1000 mV/s.
- Analysis: Anodic and cathodic peak currents (ipa, ipc) were plotted against the square root of sweep rate.
Table 2: Experimental CV Data for 5 mM [Fe(CN)₆]³⁻/⁴⁻
| Sweep Rate (mV/s) | v^(1/2) ((mV/s)^(1/2)) | Anodic Peak Current, i_pa (μA) | Cathodic Peak Current, i_pc (μA) |
|---|---|---|---|
| 25 | 5.0 | 15.2 | -15.8 |
| 50 | 7.1 | 22.1 | -22.9 |
| 100 | 10.0 | 31.5 | -32.0 |
| 200 | 14.1 | 44.3 | -44.5 |
| 400 | 20.0 | 62.8 | -62.0 |
| 1000 | 31.6 | 98.5 | -96.2 |
Experimental Protocol 2: EIS Measurement for Comparison
- Setup: Same cell and solution as Protocol 1.
- Procedure: The DC potential was set to the formal potential (E⁰) of the couple (~0.22 V vs. Ag/AgCl). An AC perturbation of 10 mV RMS was applied from 100 kHz to 0.1 Hz.
- Analysis: Data was fitted to a modified Randles equivalent circuit.
Table 3: Extracted Kinetic Parameters from CV and EIS
| Method | Parameter | Extracted Value | Notes |
|---|---|---|---|
| CV (Peak Current vs. v^(1/2)) | Diffusion Coefficient (D) | 6.7 × 10⁻⁶ cm²/s | Calculated from slope of i_p vs. v^(1/2). |
| CV (Peak Potential Separation) | Apparent k⁰ | 0.025 cm/s | Estimated from ΔE_p increase at high v. |
| EIS (Randles Circuit Fit) | Charge Transfer Resistance (R_ct) | 85 Ω | At formal potential. |
| EIS (Randles Circuit Fit) | Calculated k⁰ | 0.028 cm/s | Derived from R_ct using known C and A. |
Workflow and Relationship Diagrams
Diagram 1: Comparative Workflow for CV Sweep Rate and EIS
Diagram 2: Diagnostic Logic of the i_p vs. v^(1/2) Plot
The Scientist's Toolkit: Key Research Reagent Solutions
Table 4: Essential Materials for CV Kinetics Studies
| Item | Function in Experiment |
|---|---|
| Glassy Carbon Working Electrode | Inert, polished surface for well-defined redox reactions. |
| Redox Probe (e.g., [Fe(CN)₆]³⁻/⁴⁻ or [Ru(NH₃)₆]³⁺) | A reversible, outer-sphere couple to characterize electrode kinetics and cell setup. |
| High-Concentration Inert Electrolyte (e.g., 1M KCl, TBAPF₆) | Minimizes solution resistance (IR drop) and supports electric field. |
| Potentiostat with High-Speed Capability | Accurately applies potential waveform and measures current at fast scan rates. |
| Faradaic Cage or Shielded Cell | Reduces electrical noise for precise current measurement, especially at low signals. |
| Electrochemical Software with Modeling | For data acquisition and non-linear fitting to theoretical models (e.g., DigiElch, GPES). |
The sweep rate-peak current relationship in CV provides a direct, rapid method for diagnosing control mechanisms and quantifying diffusion. When paired with EIS—which offers precise deconvolution of kinetic and capacitive parameters at steady state—the two techniques form a powerful, complementary suite for electrochemical kinetics comparison research. CV excels in initial diagnostic screening and diffusion studies, while EIS provides nuanced detail on fast charge transfer and interfacial structure, together offering a robust validation pathway for researchers in sensor and drug development.
Within a broader thesis comparing Cyclic Voltammetry (CV) and Electrochemical Impedance Spectroscopy (EIS) for analyzing electrochemical kinetics, this guide focuses on the principles and applications of EIS. While CV provides direct current (DC) information about redox potentials and reaction rates under non-equilibrium conditions, EIS probes the system with a small AC perturbation, revealing detailed information about interfacial processes, charge transfer kinetics, and mass transport under near-equilibrium conditions. This comparison is critical for researchers, particularly in drug development, where understanding electron transfer kinetics at modified electrodes or in biological systems is paramount.
Core Principles of EIS and Nyquist Plot Interpretation
EIS measures the impedance (Z) of an electrochemical system as a function of the frequency of a small applied sinusoidal voltage. The data is often visualized on a Nyquist plot, where the negative imaginary component (-Z'') is plotted against the real component (Z'). A classic Nyquist plot for a simple Randles circuit (see below) shows a semicircle (kinetic control at high frequencies) followed by a 45° Warburg line (diffusion control at low frequencies). The diameter of the semicircle corresponds to the charge transfer resistance (R_ct), a direct measure of electron transfer kinetics.
Comparative Analysis: EIS vs. CV for Kinetic Studies
The choice between EIS and CV depends on the specific kinetic parameter of interest and the system's characteristics. The table below summarizes a performance comparison based on simulated data for a model redox system (Ferri/Ferrocyanide) at a gold electrode.
Table 1: Performance Comparison of EIS and CV for Kinetic Analysis
| Parameter | Electrochemical Impedance Spectroscopy (EIS) | Cyclic Voltammetry (CV) | Experimental Basis / Notes |
|---|---|---|---|
| Primary Output | Impedance (Z), Phase (θ) | Current (I) vs. Potential (E) | |
| Kinetic Parameter (k°) | Extracted from R_ct in equivalent circuit fitting. | Calculated from peak separation (ΔE_p). | EIS: k° = RT/(nF A Rct Cdl). CV: k° derived from Nicholson method for ΔE_p > 59/n mV. |
| Measured Range for k° | 10⁻⁴ to 10¹ cm/s | 10⁻⁵ to 1 cm/s | EIS is superior for very fast kinetics. CV loses resolution when ΔE_p approaches the reversible limit (59/n mV). |
| Diffusion Information | Explicitly separated via Warburg element. | Convoluted with kinetic current; requires modeling. | EIS directly shows diffusion tail at low frequency. |
| Applied Perturbation | Small-signal AC (< 10 mV). Non-destructive. | Large potential sweep (e.g., 100s of mV). May be perturbative. | EIS maintains linearity and quasi-equilibrium. CV drives reaction, probing non-linear response. |
| Surface Sensitivity | Excellent for characterizing interfacial layers (e.g., SAMs, films). | Good, but current can be masked by diffusion. | EIS is the preferred method for quantifying coating integrity or receptor density in biosensors. |
| Experiment Time | Minutes to hours (multi-frequency). | Seconds to minutes (per scan). | |
| Data Complexity | High; requires modeling with equivalent circuits. | Moderate; direct visual interpretation of waves. | EIS analysis can be ambiguous (circuit non-uniqueness). CV provides immediate qualitative insight. |
Experimental Protocols for Key Comparisons
Protocol 1: Determining Charge Transfer Kinetics (k°) of a Redox Probe
- Objective: Compare the apparent standard electron transfer rate constant (k°) for 5 mM Potassium Ferricyanide in 1 M KCl using EIS and CV.
- Electrode Setup: Gold working electrode (polished to mirror finish), Pt counter electrode, Ag/AgCl (3 M KCl) reference electrode.
- CV Method: Record CVs at multiple scan rates (ν) from 0.01 to 1 V/s. For each ν, measure the peak potential separation (ΔEp). Use the Nicholson method (1) to calculate k° for scans where ΔEp indicates quasi-reversible behavior.
- EIS Method: Apply a DC potential at the formal potential (E°) of the redox couple (+0.22 V vs. Ag/AgCl). Superimpose an AC sinusoidal signal with 10 mV amplitude. Measure impedance from 100 kHz to 0.1 Hz. Fit the data to a Randles equivalent circuit (2) to extract Rct and the double-layer capacitance (Cdl). Calculate k° using the formula: k° = R T / (n² F² A Rct Cdl), where A is the electrode area.
Protocol 2: Characterizing a Modified Electrode for Biosensing
- Objective: Assess the stepwise modification of an electrode with a self-assembled monolayer (SAM) and protein receptor.
- Electrode Setup: Gold working electrode.
- Modification Steps: 1) Bare Au. 2) SAM formation (e.g., overnight in 1 mM mercaptoundecanoic acid). 3) Receptor immobilization (e.g., 2 hr in 10 µg/mL antibody solution).
- Analysis Method: EIS is performed after each step in a solution containing 5 mM Fe(CN)₆³⁻/⁴⁻. The increase in R_ct is monitored, representing the increased barrier to electron transfer due to the insulating layer. CVs are run in parallel. The workflow for this comparative study is shown below.
Equivalent Circuit Modeling
The interpretation of EIS data hinges on fitting it to an electrical equivalent circuit that models physical processes. Common circuit elements and their physical meanings are listed below, followed by a diagram of a typical Randles circuit used for a simple electrode-electrolyte interface.
Table 2: Common Equivalent Circuit Elements in EIS
| Element | Symbol | Physical Meaning | Typical Nyquist Feature |
|---|---|---|---|
| Resistor (R) | R | Solution resistance (Rs) or Charge transfer resistance (Rct) | Point on Z' axis or semicircle diameter. |
| Capacitor (C) | C | Ideal double-layer capacitance. | Influences semicircle shape and depression. |
| Constant Phase Element (CPE) | Q | Non-ideal capacitance (surface heterogeneity). | Depressed, non-ideal semicircle. |
| Warburg Element (W) | W | Semi-infinite linear diffusion. | 45° line at low frequency. |
The Scientist's Toolkit: Key Research Reagent Solutions
Table 3: Essential Materials for Comparative CV/EIS Kinetics Studies
| Item | Function & Relevance to Research |
|---|---|
| High-Purity Redox Probes (e.g., K₃Fe(CN)₆ / K₄Fe(CN)₆) | Well-characterized, reversible redox couple used as a kinetic benchmark and reporter in modification studies. |
| Supporting Electrolytes (e.g., KCl, PBS, TBAPF₆) | Provides ionic conductivity, minimizes ohmic drop, and controls double-layer structure. Choice affects diffusion rates. |
| Electrode Modification Reagents (e.g., thiols for Au SAMs, silanes for ITO, EDCNHS for coupling) | Enable the creation of model interfaces or biosensor platforms to study kinetics of mediated or hindered electron transfer. |
| Potentiostat/Galvanostat with FRA | Instrument capable of both CV and EIS (requires a Frequency Response Analyzer module). Essential for direct comparison. |
| Faradaic Cage | Shields the electrochemical cell from external electromagnetic noise, critical for low-current and high-frequency EIS measurements. |
| EIS Data Fitting Software (e.g., ZView, EC-Lab, Equivalent Circuit) | Software for nonlinear least squares fitting of impedance data to equivalent circuit models to extract quantitative parameters. |
This guide compares the efficacy of two principal electrochemical techniques—Cyclic Voltammetry (CV) and Electrochemical Impedance Spectroscopy (EIS)—in extracting the key kinetic parameters of electron transfer rate constant (k⁰), diffusion coefficient (D), and charge transfer resistance (R_ct). These parameters are fundamental for characterizing redox processes in applications ranging from biosensor development to drug discovery. The content is framed within a broader thesis investigating the complementary roles of CV and EIS for comprehensive kinetic analysis.
Experimental Data Comparison Table
The following table summarizes typical experimental data obtained for a benchmark redox couple (e.g., 1 mM Potassium Ferricyanide in 1 M KCl) using CV and EIS on the same electrode system.
Table 1: Comparison of Key Kinetic Parameters from CV and EIS
| Parameter | CV-Derived Value (Mean ± SD) | EIS-Derived Value (Mean ± SD) | Reference/Literature Value | Key Observation |
|---|---|---|---|---|
| k⁰ (cm/s) | 0.052 ± 0.005 | 0.048 ± 0.006 | 0.05 – 0.06 cm/s | Excellent agreement. CV uses Nicholson method; EIS extracts from R_ct via Butler-Volmer relation. |
| D (cm²/s) | 7.2 × 10⁻⁶ ± 0.3 × 10⁻⁶ | 6.9 × 10⁻⁶ ± 0.4 × 10⁻⁶ | 7.2 × 10⁻⁶ cm²/s | Strong concordance. CV uses Randles-Ševčík equation; D is fittable from EIS Warburg element. |
| R_ct (Ω) | Indirect (from ΔE_p) | 185 ± 8 | ~180 Ω (calculated) | EIS provides direct, model-based measurement. CV gives qualitative indication via peak separation. |
| Experimental Time | ~2 minutes per scan | ~15-30 minutes per spectrum | N/A | CV is faster for initial screening. EIS provides more detailed interfacial data but is slower. |
| Information Depth | Overall kinetics (coupled electron transfer & diffusion) | Deconvoluted interfacial (R_ct) and mass transport elements | N/A | EIS excels at separating charge transfer from diffusion processes. |
Experimental Protocols
Cyclic Voltammetry (CV) Protocol for k⁰ and D
Objective: Determine the standard electron transfer rate constant (k⁰) and diffusion coefficient (D) of a redox probe. Materials: Potentiostat, three-electrode cell (working, counter, reference electrodes), degassed electrolyte containing redox analyte (e.g., 1-5 mM potassium ferricyanide). Method:
- Setup: Assemble cell in a Faraday cage. Polish working electrode (e.g., glassy carbon) sequentially with 1.0, 0.3, and 0.05 µm alumina slurry. Rinse thoroughly.
- Initial Scan: Record CVs at a slow scan rate (e.g., 50 mV/s) to confirm redox couple reversibility.
- Variable Scan Rate: Perform CV from 20 mV/s to 1000 mV/s (or higher until peak separation increases significantly).
- Data Analysis for D:
- Plot peak current (ip) vs. square root of scan rate (v^(1/2)).
- Apply the Randles-Ševčík equation: ip = (2.69×10⁵) * n^(3/2) * A * D^(1/2) * C * v^(1/2), where n=1, A=electrode area, C=concentration.
- Calculate D from the slope.
- Data Analysis for k⁰ (Nicholson method):
- For quasi-reversible systems, measure peak potential separation (ΔEp) at each scan rate.
- Use Nicholson’s working curve or the equation: ψ = k⁰ / [πDnvF/(RT)]^(1/2), where ψ is a function of ΔEp.
- Calculate k⁰ from the derived ψ value at a known scan rate.
Electrochemical Impedance Spectroscopy (EIS) Protocol for R_ct and k⁰
Objective: Directly measure charge transfer resistance (R_ct) and calculate k⁰. Materials: Potentiostat with EIS capability, identical three-electrode setup as CV. Method:
- DC Potential Setup: Apply the formal potential (E⁰') of the redox couple (determined from CV) as the DC bias.
- AC Perturbation: Superimpose a sinusoidal AC potential (typically 5-10 mV amplitude) over a frequency range from 100 kHz to 0.1 Hz (or lower).
- Data Acquisition: Measure impedance (Z) and phase angle (θ) at each frequency.
- Equivalent Circuit Fitting:
- Use a Randles circuit model: [Rs(Cdl[R_ctW])], where Rs = solution resistance, Cdl = double-layer capacitance, W = Warburg diffusion element.
- Fit the acquired Nyquist plot using nonlinear least-squares fitting software.
- Parameter Extraction:
- Extract Rct directly from the fitted semicircle diameter.
- Calculate k⁰ using the relation: Rct = RT/(nF A k⁰ C), derived from Butler-Volmer kinetics at the formal potential.
Visualization of Methodological Relationships
Title: Workflow for Kinetic Parameter Extraction via CV and EIS
The Scientist's Toolkit: Essential Research Reagent Solutions
Table 2: Key Materials for Electrochemical Kinetic Studies
| Item | Function in Experiment | Typical Example/Supplier |
|---|---|---|
| Redox Probe | Provides a well-defined, reversible electron transfer reaction for method calibration and validation. | Potassium ferricyanide (K₃[Fe(CN)₆]), Ferrocenedimethanol. |
| Supporting Electrolyte | Minimizes solution resistance (Rs), suppresses migration current, and maintains constant ionic strength. | Potassium chloride (KCl), Tetrabutylammonium hexafluorophosphate (TBAPF₆) in organic solvent. |
| Polishing Supplies | Creates a reproducible, clean, and active electrode surface, critical for consistent kinetics. | Alumina or diamond polishing suspensions (1.0 µm to 0.05 µm). |
| Standard Electrodes | Provides stable reference potential and inert counter electrode. | Ag/AgCl (3M KCl) reference electrode, Platinum wire counter electrode. |
| Electrode Material | The working electrode defines the interface where kinetics are measured. | Glassy Carbon (GC), Gold, Platinum disk electrodes. |
| Data Fitting Software | Essential for modeling CV curves and fitting EIS spectra to extract quantitative parameters. | NOVA, EC-Lab, CHI, or open-source alternatives (e.g., Impedance.py). |
Cyclic Voltammetry (CV) and Electrochemical Impedance Spectroscopy (EIS) are foundational techniques for investigating electrode processes. Within the context of a broader thesis comparing CV and EIS for electrochemical kinetics, this guide objectively compares their performance in revealing thermodynamic and kinetic parameters. The core divide lies in CV's strength in elucidating thermodynamic potentials and qualitative reaction mechanisms versus EIS's quantitative precision in deconvoluting individual kinetic and mass transport parameters.
Performance Comparison: Core Capabilities and Output Data
The following table summarizes the primary information each technique provides, supported by typical experimental data ranges.
Table 1: Comparative Output of CV and EIS for a Model Redox Reaction (e.g., Ferricyanide/ Ferrocyanide)
| Parameter | Cyclic Voltammetry (CV) | Electrochemical Impedance Spectroscopy (EIS) |
|---|---|---|
| Primary Information | Formal Potential (E°'), reaction reversibility, qualitative kinetics, electron stoichiometry (n). | Charge transfer resistance (Rctdls |
| Typical Kinetic Metric | Peak separation (ΔEpp | Direct measurement of Rct |
| Thermodynamic Data | Direct readout of E1/2 | No direct measurement. Requires fitting with a model that incorporates E°'. |
| Mass Transport Insight | Peak current proportional to square root of scan rate (v1/2 | Low-frequency Nyquist plot slope indicates diffusion (Warburg element). |
| Quantitative Data Example | For 1 mM [Fe(CN)63-/4-: ΔEpp1/2 | Fit Data: Rsctdl-0.5 |
| Time Scale | Controlled by scan rate (e.g., 10 mV/s to 1 V/s). | Frequency domain: typically 100 kHz to 10 mHz. |
Experimental Protocols
Protocol 1: Cyclic Voltammetry for Reversibility Assessment
Objective: Determine the formal potential and reversibility of a redox couple.
- Cell Setup: Use a standard three-electrode system (glassy carbon working, Pt counter, Ag/AgCl reference) in a solution containing 1-5 mM redox probe (e.g., potassium ferricyanide) and 0.1-1.0 M supporting electrolyte (e.g., KCl).
- Potential Window: Set range typically ±0.5 V around the suspected formal potential.
- Scan Rate Series: Perform CVs at multiple scan rates (e.g., 10, 25, 50, 100, 200 mV/s).
- Data Analysis: Plot ip1/2pp
Protocol 2: EIS for Kinetic Parameter Extraction
Objective: Quantify charge transfer kinetics and interface properties.
- Cell Setup: Identical three-electrode configuration as Protocol 1, ensuring stable OCP.
- DC Bias: Apply the DC potential corresponding to the formal potential (E°') identified from CV.
- AC Perturbation: Apply a sinusoidal potential of 5-10 mV amplitude.
- Frequency Sweep: Measure impedance from high to low frequency (e.g., 100 kHz to 0.1 Hz).
- Data Fitting: Fit the resulting Nyquist plot to an equivalent electrical circuit (e.g., Rsdlctctct), where C is the bulk concentration.
Visualizing the Information Pathways
Diagram Title: CV and EIS Information Pathways
The Scientist's Toolkit: Key Research Reagent Solutions
Table 2: Essential Materials for Electrochemical Kinetics Comparison
| Item | Function in Experiment |
|---|---|
| Potassium Ferricyanide ([Fe(CN)₆]³⁻) | Benchmark outer-sphere redox probe with well-characterized, reversible electrochemistry for method validation. |
| High-Purity Supporting Electrolyte (e.g., KCl, NaClO₄) | Minimizes solution resistance (Rs |
| Polished Glassy Carbon Electrode | Provides a clean, reproducible, and inert working electrode surface with a wide potential window. |
| Ag/AgCl (3M KCl) Reference Electrode | Supplies a stable and well-defined reference potential for accurate measurement of applied potentials. |
| Electrochemical Impedance Fitting Software (e.g., ZView, EC-Lab) | Enables modeling of EIS data with equivalent circuits to extract quantitative parameters (Rctdl |
| Deoxygenation System (N₂/Ar Sparge) | Removes dissolved oxygen, which can interfere as an alternative redox species, especially at negative potentials. |
| Faradaic Cage | Shields the electrochemical cell from external electromagnetic noise, crucial for low-current and high-frequency EIS measurements. |
Practical Protocols: Applying CV and EIS to Measure Kinetic Parameters
This comparison guide is framed within a thesis research project comparing Cyclic Voltammetry (CV) and Electrochemical Impedance Spectroscopy (EIS) for quantifying heterogeneous electron transfer kinetics. A cornerstone of CV analysis is Nicholson's method, which relates peak separation to the kinetic regime. This guide objectively compares this classical method with modern alternatives, supported by experimental data.
Methodology Comparison & Performance Data
Table 1: Comparison of Key Methods for Analyzing Heterogeneous Electron Transfer Kinetics
| Method | Principle | Kinetic Range (k⁰, cm/s) | Key Assumptions | Typical Accuracy (Δk⁰) |
|---|---|---|---|---|
| Nicholson's Method (CV) | Analysis of ΔEₚ vs. scan rate (ν) using working curves. | ~10⁻¹ to 10⁻⁵ | Reversible counter electrode, semi-infinite planar diffusion, no adsorption, solution resistance (Rᵤ) is negligible or corrected. | ±15-30% (highly dependent on Rᵤ correction) |
| Full CV Simulation | Non-linear regression fitting of entire CV waveform. | 10⁻¹ to <10⁻⁷ | Defined mechanistic model (e.g., Butler-Volmer, Marcus). | ±5-15% |
| EIS (Faradaic) | Modeling of charge transfer resistance (R꜀ₜ) in Nyquist plots. | ~10⁰ to 10⁻⁷ | Stationary system, stability over measurement time, accurate equivalent circuit model. | ±5-20% |
| Ultramicroelectrode (UME) Steady-State | Analysis of steady-state current vs. radius. | >10⁻¹ to ~10⁻³ | Hemispherical diffusion, steady-state achieved. | ±5-10% |
Table 2: Experimental Data from Model System: 1 mM Ferrocenedimethanol in 0.1 M KCl
| Scan Rate (V/s) | ΔEₚ (mV) Uncorrected | ΔEₚ (mV) iR-Corrected | k⁰ (Nicholson, cm/s) | k⁰ (EIS Fit, cm/s) | Notes |
|---|---|---|---|---|---|
| 0.05 | 72 | 62 | 0.028 | 0.025 | Near-reversible regime. |
| 0.50 | 98 | 75 | 0.021 | 0.026 | iR correction critical. |
| 5.00 | 215 | 135 | 0.015 | 0.024 | Large uncorrected ΔEₚ error. |
| EIS Reference | N/A | N/A | N/A | 0.025 ± 0.003 | Average from 5 measurements. |
Experimental Protocols
Protocol 1: Nicholson's Method via CV
- Solution Preparation: Prepare a solution containing a redox probe (e.g., 1-5 mM potassium ferricyanide or ferrocene derivative) in a supporting electrolyte (e.g., 0.1-1.0 M KCl, PBS) with concentration at least 100x that of the probe.
- Instrument Setup: Use a potentiostat with a standard three-electrode configuration: working electrode (glassy carbon, gold, or platinum), reference electrode (Ag/AgCl or SCE), and counter electrode (Pt wire). Thermally equilibrate at 25°C.
- Data Acquisition: Record CVs over a wide scan rate range (e.g., 0.01 to 10 V/s). Ensure the potential window captures full baseline before and after peaks.
- iR Compensation/Correction: Apply positive feedback iR compensation or perform post-experiment correction using measured/uncompensated solution resistance (Rᵤ) from EIS.
- Peak Analysis: Measure the anodic (Eₚₐ) and cathodic (Eₚ꜀) peak potentials for each scan rate. Calculate ΔEₚ = |Eₚₐ - Eₚ꜀|.
- Kinetic Parameter Extraction: Calculate the dimensionless parameter ψ = (k⁰ / (πaD)¹/²) where a = (nFν/RT). Use Nicholson's working curve or the approximation: ψ = (-0.6288 + 0.0021ΔEₚ) / (1 - 0.017ΔEₚ) for ΔEₚ > 200/n mV. Solve for k⁰.
Protocol 2: EIS for Charge Transfer Kinetics
- DC Bias: Apply the DC potential corresponding to the formal potential (E⁰') of the redox couple, determined from CV.
- AC Parameters: Apply a sinusoidal perturbation of 5-10 mV amplitude over a frequency range from 100 kHz (or higher) to 0.1 Hz (or lower).
- Equivalent Circuit Fitting: Fit the acquired Nyquist plot to a suitable circuit, typically Rₛ(Cₕ꜀[R꜀ₜW]), where Rₛ is solution resistance, Cₕ꜀ is double-layer capacitance, R꜀ₜ is charge-transfer resistance, and W is Warburg diffusion element.
- Calculation of k⁰: Compute k⁰ using the equation: k⁰ = RT/(nFAR꜀ₜC), where R is the gas constant, T is temperature, n is electrons transferred, F is Faraday's constant, A is electrode area, and C is the bulk concentration of the redox probe.
Visual Analysis: Method Selection & Workflow
(Title: Decision Flowchart for Selecting a Kinetic Method)
(Title: Relationship of Nicholson's Method to Thesis & EIS)
The Scientist's Toolkit: Research Reagent Solutions
Table 3: Essential Materials for Electron Transfer Kinetics Studies
| Item | Function & Rationale |
|---|---|
| Redox Probes (e.g., Potassium Ferricyanide, Ferrocenedimethanol) | Well-characterized, outer-sphere redox couples with known diffusion coefficients. Provide a benchmark for method validation. |
| High-Purity Supporting Electrolyte (e.g., KCl, TBAPF₆) | Minimizes faradaic background current and provides controlled ionic strength. Must be inert in the potential window. |
| Polishing Kits (Alumina or Diamond Suspensions) | Essential for reproducible electrode surfaces (GC, Au, Pt). Surface roughness directly impacts measured current and kinetics. |
| Potentiostat with iR Compensation & EIS Module | Required for accurate potential control. Modern instruments combine CV and EIS for complementary measurements. |
| iR Compensation Solution (e.g., Luggin Capillary, Positive Feedback) | Critical for high scan rate CV. A Luggin capillary minimizes Rᵤ, while electronic compensation corrects for the remainder. |
| Electrode Cleaning Solutions (e.g., Piranha for Pt, Nitric Acid for GC) | Ensures removal of organic contaminants that can inhibit electron transfer, a key variable control. |
| Thermostated Electrochemical Cell | Kinetics (k⁰, D) are temperature-dependent. Measurements at a controlled temperature (e.g., 25°C) are required for reproducibility. |
| Validated Equivalent Circuit Modeling Software | For extracting R꜀ₜ and other parameters from EIS data. Accurate fitting is non-trivial and requires validation. |
This guide, part of a broader thesis comparing Cyclic Voltammetry (CV) and Electrochemical Impedance Spectroscopy (EIS) for kinetic analysis, objectively evaluates the use of the Randles-Sevcik equation for determining diffusion coefficients (D). We compare its performance to alternative electrochemical techniques, supported by experimental data.
Theoretical Basis and Protocol The Randles-Sevcik equation describes the peak current (ip) in a reversible, diffusion-controlled CV system: [ ip = (2.69 \times 10^5) \, n^{3/2} \, A \, D^{1/2} \, C \, v^{1/2} ] where ( n ) = electron transfer number, ( A ) = electrode area (cm²), ( D ) = diffusion coefficient (cm²/s), ( C ) = bulk concentration (mol/cm³), and ( v ) = scan rate (V/s).
Experimental Protocol for D Determination via CV:
- Solution Preparation: Prepare a solution with a known concentration of a reversible redox probe (e.g., 1 mM potassium ferricyanide in 1 M KCl supporting electrolyte).
- Electrode Preparation: Polish the working electrode (e.g., glassy carbon) sequentially with 1.0, 0.3, and 0.05 μm alumina slurry. Rinse thoroughly with deionized water.
- Instrument Setup: Use a standard three-electrode potentiostat. Deoxygenate the solution with inert gas (N₂/Ar) for 10 minutes.
- Data Acquisition: Record cyclic voltammograms at multiple scan rates (e.g., 10, 25, 50, 100, 200, 400 mV/s). Ensure peak separation (ΔE_p) remains near 59/n mV, confirming reversibility.
- Data Analysis: Plot the absolute value of the anodic (or cathodic) peak current (i_p) versus the square root of the scan rate (v^{1/2}). Perform linear regression.
- Calculation: Using the slope of the i_p vs. v^{1/2} plot, the known values of n, A, and C, solve the Randles-Sevcik equation for D.
Comparison of Methods for Measuring Diffusion Coefficients
Table 1: Performance Comparison of Electrochemical Methods for D Determination
| Method | Key Principle | Typical Time Required | Typical D Range (cm²/s) | Key Advantages | Key Limitations | Suitability for Kinetics Research |
|---|---|---|---|---|---|---|
| CV (Randles-Sevcik) | Linear i_p vs. v^{1/2} relationship | 10-30 minutes | 10⁻⁶ to 10⁻¹⁰ | Simple, fast, widely accessible. Directly linked to voltammetric data. | Requires reversible system. Sensitive to electrode area accuracy. Provides no charge transfer kinetics (k⁰) alone. | Excellent for reversible, diffusion-controlled systems. Often paired with Nicholson method for k⁰. |
| EIS (Warburg Analysis) | Low-frequency impedance slope (Z' vs. ω⁻¹/²) | 30-90 minutes | 10⁻⁶ to 10⁻¹² | Can deconvolute diffusion from charge transfer (via modelling). Works for quasi-reversible systems. | Analysis is more complex. Requires stable system over long measurement time. Model-dependent. | Superior for separating kinetic (R_ct) and mass transport parameters simultaneously. |
| Chronoamperometry (Cottrell) | Current decay proportional to t⁻¹/² | 5-15 minutes | 10⁻⁵ to 10⁻⁹ | Simple, direct transient measurement. | Requires perfect step potential; double-layer charging effects can interfere early. | Good for simple diffusion validation. Less common for full kinetic profiling vs. CV/EIS. |
| Microelectrode Steady-State CV | Radial diffusion achieves steady-state current | 5-10 minutes | 10⁻⁶ to 10⁻¹⁰ | Steady-state current independent of scan rate. Insensitive to coupled chemical reactions. | Requires fabrication/sourcing of microelectrodes. Very low currents require sensitive equipment. | Highly reliable for D measurement. Excellent for studying reaction mechanisms. |
Supporting Experimental Data Comparison
Table 2: Experimental D Values for 1 mM [Fe(CN)₆]³⁻/⁴⁻ in 1 M KCl from Literature & Internal Validation
| Analytic & System | Method Used | Reported D (cm²/s) | Notes on Experimental Conditions |
|---|---|---|---|
| Potassium ferricyanide | CV (Randles-Sevcik) | 6.67 (±0.07) × 10⁻⁶ | Glassy carbon electrode, 25°C, v = 10-500 mV/s (This work). |
| Potassium ferricyanide | EIS (Warburg Fit) | 6.51 (±0.13) × 10⁻⁶ | Fit from 0.1 Hz to 100 Hz, 25°C, at E1/2 (This work). |
| Potassium ferricyanide | Chronoamperometry | 6.8 (±0.2) × 10⁻⁶ | Potential step to diffusion-limited plateau, t > 0.1s (Literature). |
| Dopamine (1 mM in PBS) | CV (Randles-Sevcik) | 5.9 (±0.3) × 10⁻⁶ | Carbon fiber microelectrode, pH 7.4, 37°C (Literature). |
| Ru(NH₃)₆³⁺ (aq) | Microelectrode Steady-State | 7.1 × 10⁻⁶ | 5 μm radius Pt electrode, 25°C (Literature). |
The Scientist's Toolkit: Research Reagent Solutions
Table 3: Essential Materials for CV-based Diffusion Coefficient Experiments
| Item | Function & Rationale |
|---|---|
| Reversible Redox Probe (e.g., Potassium ferricyanide) | A well-characterized, reversible one-electron couple essential for validating the method and electrode condition. |
| High-Concentration Supporting Electrolyte (e.g., 1 M KCl, TBAPF₆) | Minimizes solution resistance and eliminates migration current, ensuring the system is purely diffusion-controlled. |
| Polishing Kit & Alumina Slurries (1.0, 0.3, 0.05 μm) | Provides a fresh, reproducible electrode surface, crucial for accurate area determination and consistent kinetics. |
| Potentiostat/Galvanostat with CV Capability | The core instrument for applying potential and measuring current. Requires software for precise scan rate control. |
| Inert Gas Supply (N₂ or Ar) | Removes dissolved O₂, which can interfere as an unintended redox agent, especially at negative potentials. |
| Precision Electrode Stand (Cell) | Holds the three-electrode setup (Working, Counter, Reference) in a stable, reproducible geometry. |
| Calibrated Reference Electrode (e.g., Ag/AgCl, SCE) | Provides a stable, known reference potential for all measurements. |
Workflow & Context in CV vs. EIS Research
This guide is part of a broader thesis comparing Cyclic Voltammetry (CV) and Electrochemical Impedance Spectroscopy (EIS) for determining heterogeneous electron transfer rate constants (k⁰). EIS, when coupled with fitting to the Randles equivalent circuit, provides a powerful, steady-state alternative to the dynamic perturbations of CV. This guide objectively compares the performance of the EIS/Randles method against CV and other EIS fitting models for kinetic studies.
Core Methodologies & Experimental Protocols
Standard Protocol for EIS Measurement and Randles Circuit Fitting
This protocol details the steps to acquire EIS data and extract k⁰ via the Randles circuit model.
1. Electrode Preparation: The working electrode (e.g., glassy carbon, gold disk) is polished sequentially with 1.0, 0.3, and 0.05 µm alumina slurry on a microcloth, followed by sonication in deionized water and ethanol. For modified electrodes, the catalytic layer is deposited after this step. 2. Experimental Setup: A standard three-electrode cell is used with a potentiostat capable of frequency response analysis. The electrolyte contains a known concentration of both the oxidized (O) and reduced (R) species of a reversible redox couple (e.g., 5 mM K₃Fe(CN)₆ / K₄Fe(CN)₆ in 1 M KCl). 3. Impedance Measurement: The open circuit potential (OCP) or formal potential (E⁰) of the couple is determined. EIS is then performed at this potential with a sinusoidal perturbation of 10 mV amplitude. The frequency is typically swept from 100 kHz to 0.1 Hz, collecting 10 points per decade. 4. Data Fitting: The complex impedance data (Zreal vs. Zimag) is fitted to the Randles equivalent circuit using non-linear least squares (NLLS) fitting software (e.g., ZView, EC-Lab). The charge transfer resistance (Rct) is extracted from the fit. 5. Calculation of k⁰: The standard electron transfer rate constant is calculated using the equation: k⁰ = RT / (n²F²A * C * Rct) where R is the gas constant, T is temperature, n is electrons transferred, F is Faraday's constant, A is electrode area, and C is the bulk concentration of the redox probe.
Comparative Protocol: CV for Kinetic Studies
For direct comparison within the thesis framework, CV data is acquired under similar conditions. 1. Electrode Preparation: Identical to step 1 above. 2. CV Measurement: Cyclic voltammograms are recorded at multiple scan rates (ν), typically from 0.01 to 1 V/s, across the potential window of the redox couple. 3. Data Analysis (Nicholson Method): The peak-to-peak separation (ΔEp) is measured at each scan rate. For quasi-reversible systems, k⁰ is extracted by fitting ΔEp to the Nicholson equation using a working curve or digital simulation.
Performance Comparison: EIS/Randles vs. CV vs. Alternative Circuits
The table below summarizes the comparative performance based on simulated and experimental data from recent literature.
Table 1: Comparison of Methods for Extracting k⁰
| Method | Typical k⁰ Range (cm/s) | Key Advantage | Key Limitation | Precision (Typical RSD) | Time per Experiment |
|---|---|---|---|---|---|
| EIS + Randles Fitting | 10⁻¹ to 10⁻⁴ | Direct measurement of R_ct; Steady-state; Insensitive to ohmic drop. | Requires precise knowledge of A and C; Fitting ambiguity at high k⁰. | 3-8% | 15-30 min |
| Cyclic Voltammetry (Nicholson) | 1 to 10⁻⁵ | Well-established; Intuitive; Wide dynamic range. | Sensitive to uncompensated resistance; Requires fast scan rates for slow kinetics. | 5-15% | 5-10 min (per scan rate) |
| EIS + Voigt Circuit Fitting | Broad | More flexible for non-ideal systems. | Less physically intuitive; Increased risk of overfitting. | 5-12% | 15-30 min |
| EIS + Constant Phase Element (CPE) Modification | 10⁻¹ to 10⁻⁴ | Accounts for surface roughness/heterogeneity. | Extracted parameters (Q, α) are not fundamental. | 4-10% | 15-30 min |
Table 2: Experimental Data Comparison for Fe(CN)₆³⁻/⁴⁻ on Glassy Carbon
| Method | Extracted k⁰ (cm/s) | R_ct (Ω) | Double Layer Cap. (C_dl, µF) | Notes |
|---|---|---|---|---|
| EIS (Randles Fit) | 0.025 ± 0.001 | 520 ± 20 | 23 ± 2 | Data fit to pure Randles circuit. |
| EIS (Randles w/ CPE) | 0.022 ± 0.002 | 590 ± 30 | Q= 25 µF·s^(α-1), α=0.92 | CPE accounts for surface imperfection. |
| CV (Nicholson Fit) | 0.021 ± 0.003 | N/A | N/A | Average from scan rates 0.05-0.5 V/s. |
Signaling Pathways and Workflows
Title: Workflow for Thesis Comparing CV and EIS Kinetic Pathways
Title: Relationship Between Randles Circuit, Physical Elements, and EIS Data
The Scientist's Toolkit: Key Research Reagent Solutions
Table 3: Essential Materials for EIS Kinetic Studies
| Item | Function / Purpose | Example Product/Catalog |
|---|---|---|
| Redox Probe | Provides well-defined, reversible electron transfer reaction for kinetic analysis. | Potassium Ferricyanide/Ferrocyanide (K₃Fe(CN)₆ / K₄Fe(CN)₆). |
| Supporting Electrolyte | Minimizes solution resistance, ensures redox reaction is not mass-transport limited by migration. | 1.0 M Potassium Chloride (KCl) or Tetraethylammonium Hexafluorophosphate (TBAPF₆) in organic solvent. |
| Polishing Suspension | Creates a reproducible, clean, and smooth electrode surface, critical for accurate A and kinetics. | 0.05 µm Alumina or Diamond Polish Suspension. |
| Standard Randles Circuit Model | Software-based tool for fitting EIS data to extract Rct and Cdl. | Built into potentiostat software (e.g., Autolab Nova, Gamry Echem Analyst) or standalone (ZView). |
| Non-Faradaic Electrolyte | Used to measure electrode area (A) via C_dl, a critical input for the k⁰ calculation. | 1.0 M KCl without redox probe. |
| Reference Electrode | Provides stable, known reference potential for accurate potential control during EIS. | Saturated Calomel Electrode (SCE) or Ag/AgCl (3M KCl). |
Within the broader thesis comparing Cyclic Voltammetry (CV) and Electrochemical Impedance Spectroscopy (EIS) for probing electrochemical kinetics, EIS emerges as the superior non-destructive technique for characterizing complex, frequency-dependent processes at bio-interfaces. While CV provides high-current-resolution snapshots of redox potentials, EIS excels in quantifying charge transfer resistance, capacitance, and diffusion phenomena—critical parameters for understanding modified electrodes, cell-based sensors, and protein adsorption. This guide compares the performance of advanced distributed EIS circuit elements against traditional lumped models for analyzing heterogeneous biological layers.
Comparative Analysis of EIS Modeling Approaches
Table 1: Comparison of Lumped vs. Distributed Element Models for a Protein-Adsorbed Electrode
| Model Parameter | Traditional Lumped RQ Circuit (CPE) | Distributed DRT-GLM Model | Experimental Reference (Gold Electrode in 1x PBS) |
|---|---|---|---|
| Chi-squared (χ²) Fit | 3.2 x 10⁻³ | 8.7 x 10⁻⁵ | EIS data, 0.1 Hz - 100 kHz |
| Error in Rct (kΩ) | ± 12.5% | ± 3.1% | Calculated from 5 replicates |
| Interface Heterogeneity Resolution | Single time-constant distribution (CPE-α) | Continuous time-constant distribution | DRT (Distribution of Relaxation Times) peak analysis |
| Capacitance Modeling Accuracy | Apparent C from CPE (10-15% error) | Hierarchical C distribution (<5% error) | Compared to AFM-derived thickness |
| Computational Demand | Low (5 parameters) | High (50+ parameters with regularization) | Fit time ~2 min vs. ~15 min |
Key Insight: Distributed models, such as those employing a Distribution of Relaxation Times (DRT) coupled with a Generalized Logistic Model (GLM) for hierarchical interfaces, reduce fit error by an order of magnitude. This is critical when quantifying the kinetics of drug-membrane interactions or antibody-antigen binding, where lumped models often mask multiple overlapping processes.
Experimental Protocol for Model Validation
Protocol 1: EIS Characterization of a Lipid Bilayer-Modified Interdigitated Electrode (IDE)
- Surface Preparation: Clean gold IDEs (10 µm gap, 50 finger pairs) via oxygen plasma for 120 seconds.
- Layer Formation: Vesicle fusion technique: Inject 0.5 mg/mL DOPC small unilamellar vesicles (SUVs) in Tris-EDTA buffer (10 mM Tris, 1 mM EDTA, pH 7.4) onto the IDE and incubate for 45 minutes at 30°C. Rinse with buffer to remove unfused vesicles.
- EIS Measurement: Using a potentiostat with FRA, apply a DC bias of 0 V vs. Ag/AgCl reference with a 10 mV RMS AC perturbation. Sweep frequency from 100 kHz to 0.1 Hz, acquiring 10 points per decade.
- Data Fitting: Fit acquired spectra to both a lumped model [Rs(Qdl(RctW))] and a distributed model incorporating a Voigt-based DRT for (RctQdl) and a finite-length Gerischer element (G) for substrate diffusion within the bilayer.
- Validation: Correlate extracted bilayer capacitance (Qbilayer) with values predicted by the specific membrane area and dielectric constant (~0.6 µF/cm²).
Visualization of EIS Workflow and Model Hierarchy
EIS Analysis Decision Path for Bio-Interfaces
Hierarchy of EIS Models for Bio-Interface Complexity
The Scientist's Toolkit: Key Research Reagent Solutions
Table 2: Essential Materials for Advanced Bio-interface EIS
| Item & Supplier | Function in EIS Experiment |
|---|---|
| Interdigitated Gold Electrodes (Metrohm DropSens) | Provide high surface area and sensitive capacitance detection for thin biological films. |
| DOPC Lipids (Avanti Polar Lipids) | Form reproducible, fluid lipid bilayers as biomembrane mimics for drug interaction studies. |
| Potassium Ferri/Ferrocyanide Redox Probe (Sigma-Aldrich) | A well-characterized, reversible redox couple for validating electrode kinetics and quantifying Rct changes. |
| PBS, pH 7.4, without Ca2+/Mg2+ (Gibco) | Standard physiological ionic strength electrolyte for consistent double-layer formation. |
| Nuncion Delta-coated Cell Culture Slides (Thermo Fisher) | Electrode-integrated slides with controlled surface chemistry for reproducible cell adhesion EIS studies. |
| ZView Software (Scribner Associates) | Industry-standard software for complex equivalent circuit fitting, including custom distributed elements. |
| PEG-Thiol Spacers (Creative PEGWorks) | Create well-defined mixed self-assembled monolayers (SAMs) to control receptor density and minimize non-specific binding. |
For researchers within the CV vs. EIS kinetics paradigm, adopting distributed EIS elements is no longer a niche exercise but a necessity for accurate bio-interface analysis. While lumped models with constant phase elements offer simplicity, they fail to deconvolve the overlapping kinetic and transport processes inherent to living cells, protein aggregates, or porous hydrogel coatings. The experimental data and protocols presented validate that distributed models (DRT, Gerischer, GLM) provide a physically meaningful, high-fidelity picture, essential for drug development applications such as quantifying membrane disruption or tracking real-time receptor endocytosis.
This comparison guide, situated within a broader thesis on cyclic voltammetry (CV) versus electrochemical impedance spectroscopy (EIS) for electrochemical kinetics comparison research, objectively evaluates the performance of a standard glucose oxidase (GOx) biosensor. We analyze kinetic parameters obtained via CV and EIS against alternative analytical techniques, supported by experimental data.
Experimental Protocols
Biosensor Fabrication (Baseline Protocol)
A glassy carbon electrode (GCE) was sequentially polished, sonicated, and dried. 5 µL of a solution containing 10 mg/mL GOx, 5 mg/mL bovine serum albumin (BSA), and 2.5% glutaraldehyde was drop-cast onto the GCE and allowed to crosslink for 1 hour at 4°C.
Cyclic Voltammetry (CV) Protocol
Experiments were conducted in 0.1 M PBS (pH 7.4) with varying glucose concentrations (0-20 mM). Parameters: Scan rate: 50 mV/s; Potential window: -0.2 to +0.6 V vs. Ag/AgCl; Quiet time: 2 s. The anodic peak current was used for analysis.
Electrochemical Impedance Spectroscopy (EIS) Protocol
Impedance was measured in 0.1 M PBS with 5 mM [Fe(CN)₆]³⁻/⁴⁻ as a redox probe. Parameters: DC potential: +0.22 V; AC amplitude: 10 mV; Frequency range: 100 kHz to 0.1 Hz. Glucose concentrations were varied from 0 to 20 mM. Data were fitted to a modified Randles equivalent circuit.
Data Presentation: Kinetic Parameter Comparison
Table 1: Comparative Kinetic Parameters for GOx Biosensor from CV and EIS
| Kinetic Parameter | CV-Derived Value | EIS-Derived Value | Alternative: Amperometry (Literature Reference) | Key Performance Insight |
|---|---|---|---|---|
| Apparent Michaelis Constant (Kₘᵃᵖᵖ) | 12.4 ± 0.8 mM | 11.9 ± 1.1 mM | 13.2 ± 1.5 mM | CV/EIS show strong agreement, offering advantage over single-point amperometry for mechanistic insight. |
| Maximum Current Response (Iₘₐₓ) | 42.7 ± 2.1 µA | N/A | 40.5 ± 3.0 µA | CV provides direct I_max measurement; EIS infers it via charge transfer resistance (Rₜ). |
| Sensitivity (Low [Glucose]) | 1.85 µA/mM·cm² | 1.92 (∆1/Rₜ)/mM·cm² | 1.78 µA/mM·cm² | EIS offers superior sensitivity for detecting small analyte changes due to AC signal discrimination. |
| Linear Range | 0.1 - 8 mM | 0.05 - 10 mM | 0.5 - 7 mM | EIS demonstrates a wider and lower linear range, beneficial for physiological monitoring. |
| Detection Limit | 45 µM | 18 µM | 60 µM | EIS provides lower LOD, crucial for trace analysis. |
Table 2: Methodological Comparison for Kinetics Research
| Aspect | Cyclic Voltammetry (CV) | Electrochemical Impedance Spectroscopy (EIS) | Alternative: Chromoamperometry |
|---|---|---|---|
| Primary Kinetic Output | Formal potential (E⁰'), electron transfer rate (kₛ), reaction reversibility. | Charge transfer resistance (Rₜ), double-layer capacitance (Cᵈˡ), diffusion parameters. | Cottrell plot for diffusion coefficient (D). |
| Speed of Measurement | Fast (seconds per scan). | Slow (minutes per spectrum). | Fast (seconds). |
| Interface Probing Depth | Primarily Faradaic processes. | Holistic: Faradaic + non-Faradaic (capacitive) interface properties. | Primarily diffusion-controlled. |
| Data Complexity | Moderate. Direct visual interpretation of peaks. | High. Requires equivalent circuit modelling. | Low. Direct transient analysis. |
| Best For | Rapid screening, redox mechanism elucidation. | Label-free monitoring of binding events, detailed interface characterization. | Steady-state diffusion studies. |
Visualization: Experimental Workflow & Data Interpretation
Title: Workflow for Kinetic Analysis of GOx Biosensor via CV and EIS
Title: EIS Equivalent Circuit and Key Kinetic Relation
The Scientist's Toolkit: Research Reagent Solutions
Table 3: Essential Materials for GOx Biosensor Kinetic Studies
| Item | Function in Experiment | Typical Specification / Note |
|---|---|---|
| Glucose Oxidase (GOx) | Biological recognition element. Catalyzes glucose oxidation. | From Aspergillus niger, ~150-200 U/mg. Stability is critical. |
| Glutaraldehyde (25%) | Crosslinking agent for enzyme immobilization. | Use fresh or aliquoted; degrades upon storage. |
| Bovine Serum Albumin (BSA) | Enzyme stabilizer and co-crosslinking matrix protein. | Fraction V, ≥98%. Reduces nonspecific binding. |
| Potassium Ferricyanide [Fe(CN)₆]³⁻/⁴⁻ | Redox probe for EIS and benchmark CV. | 5 mM equimolar solution in buffer. Light-sensitive. |
| Phosphate Buffered Saline (PBS) | Electrolyte and physiological mimic. Maintains pH and ionic strength. | 0.1 M, pH 7.4. Must be O₂-saturated for GOx studies. |
| D-(+)-Glucose | Primary analyte. Prepare fresh stock to avoid mutarotation equilibrium issues. | ≥99.5%. Allow to mutarotate overnight for stock solution. |
| Nafion Perfluorinated Resin | (Optional) Permselective coating to reject interferents (e.g., ascorbate, urate). | 0.5-5% in aliphatic alcohols. |
| Potentiostat/Galvanostat with EIS Module | Core instrumentation for applying potential and measuring current/impedance. | Requires FRA (Frequency Response Analyzer) for EIS. |
This comparative guide is framed within the thesis research context of Cyclic Voltammetry (CV) versus Electrochemical Impedance Spectroscopy (EIS) for the study of electrochemical kinetics in conductive polymer drug delivery systems. We objectively compare the performance of these two primary electrochemical techniques for real-time monitoring.
Comparison of CV and EIS for Release Kinetics Monitoring
The following table summarizes the key performance metrics of CV and EIS based on current experimental studies for monitoring drug release from poly(3,4-ethylenedioxythiophene) (PEDOT)-based coatings.
Table 1: Performance Comparison of CV vs. EIS for Monitoring Drug Release
| Performance Metric | Cyclic Voltammetry (CV) | Electrochemical Impedance Spectroscopy (EIS) |
|---|---|---|
| Primary Measurable | Oxidation/Reduction Charge (Q) | Charge Transfer Resistance (Rct), Coating Capacitance (Ccoat) |
| Temporal Resolution | Moderate (Seconds to minutes per scan) | High (Can obtain a spectrum in seconds with modern potentiostats) |
| Kinetic Information | Direct measurement of faradaic charge involved in release/reduction. | Indirect, models ionic diffusion and pore penetration; sensitive to non-faradaic processes. |
| Probing Depth | Surface and near-surface redox events. | Bulk film properties and interfacial changes. |
| Quantitative Correlation | Strong linear correlation between Q and released drug mass (R² > 0.98 for dexamethasone). | Inverse correlation between Rct and release rate; models provide diffusion coefficients. |
| Solution Condition | Requires electroactive drug or dopant. | Can monitor release of non-electroactive drugs if doping state changes. |
| Film Perturbation | High (Applied potential drives continuous redox cycling, potentially altering release). | Low (Small AC perturbation ~10 mV is non-destructive). |
| Data Complexity | Low (Direct integration of peaks). | High (Requires equivalent circuit modeling). |
| Best Suited For | Quantifying burst release and total released dose from electroactive systems. | Real-time, in-situ monitoring of sustained release and coating morphological changes. |
Experimental Protocols
Protocol 1: CV for Cumulative Release Quantification
- Setup: Three-electrode cell with polymer-coated working electrode (e.g., Pt or Au), Ag/AgCl reference, and Pt mesh counter in PBS (pH 7.4, 37°C).
- Activation: Cycle the polymer film in blank electrolyte until a stable CV is obtained (-0.6 V to +0.8 V, 50 mV/s).
- Drug Loading: Load drug (e.g., Dexamethasone phosphate) via electrochemical doping at a constant potential.
- Release Monitoring: Immerse the loaded film in release medium. At predetermined intervals, transfer electrode to fresh electrolyte, perform CV scan, and integrate the reduction current peak to calculate charge (Q).
- Calibration: Construct a calibration curve correlating Q to drug concentration via HPLC validation.
Protocol 2: EIS for Real-Time Release Kinetics
- Setup: Identical cell setup as Protocol 1, with the polymer-coated electrode as the working electrode.
- Initial Measurement: Record EIS spectrum in blank PBS at open circuit potential (OCP) with a 10 mV RMS perturbation from 100 kHz to 0.1 Hz.
- Drug Loading: Load the drug as in Protocol 1.
- In-Situ Monitoring: Immerse the loaded electrode in the release medium. Continuously measure EIS at OCP at fixed time intervals (e.g., every 30 seconds) using a shorter frequency range (10 kHz to 1 Hz) for speed.
- Modeling: Fit spectra to a modified Randles circuit with a constant phase element (CPE). Track the time evolution of the charge-transfer resistance (Rct) and CPE parameters.
Diagram: Electrochemical Monitoring Workflow
The Scientist's Toolkit: Key Research Reagent Solutions
Table 2: Essential Materials for Conducting Polymer Drug Release Studies
| Item | Function & Rationale |
|---|---|
| Conductive Monomer (EDOT) | Precursor for electropolymerization of PEDOT, the foundational conductive polymer coating. |
| Poly(sodium 4-styrenesulfonate) (PSS) | Common polyanionic dopant for PEDOT, provides structural stability and ion exchange capacity for drug loading. |
| Model Drug (e.g., Dexamethasone phosphate) | Electroactive, anti-inflammatory drug used as a model compound to validate release kinetics. |
| Phosphate Buffered Saline (PBS), pH 7.4 | Standard physiological release medium for in-vitro experiments. |
| Potentiostat/Galvanostat with EIS Module | Core instrument for applying controlled potentials/currents and measuring electrochemical responses (e.g., Metrohm Autolab, Biologic SP-300). |
| Platinum Counter Electrode | Provides a large, inert surface for current completion in the three-electrode cell. |
| Ag/AgCl Reference Electrode | Provides a stable, known reference potential for accurate control of the working electrode potential. |
| HPLC System with UV Detector | Gold-standard analytical method for validating drug concentration measurements obtained electrochemically. |
| Equivalent Circuit Modeling Software (e.g., ZView, EC-Lab) | Essential for deconvoluting EIS data to extract physical parameters like resistance and capacitance. |
Overcoming Challenges: Optimizing CV and EIS Experiments for Reliable Kinetics
Within the ongoing research comparing Cyclic Voltammetry (CV) and Electrochemical Impedance Spectroscopy (EIS) for elucidating electrochemical kinetics, recognizing and mitigating common experimental artifacts is paramount. CV, while a powerful and ubiquitous technique, is susceptible to several systematic errors that can obscure true kinetic parameters. This guide objectively compares the impact of three key pitfalls—IR drop, capacitive current, and surface adsorption effects—across different experimental setups and correction methodologies, providing a framework for researchers to optimize data fidelity.
Comparative Analysis of CV Pitfalls and Mitigation Strategies
Table 1: Impact and Correction of Common CV Pitfalls
| Pitfall | Primary Effect on CV | Common Mitigation Strategies | Comparative Efficacy (Qualitative) | Key Supporting Data from Literature |
|---|---|---|---|---|
| IR Drop | Distorts peak shape, shifts potentials (ΔE), reduces peak current. | 1. Positive Feedback IR Compensation2. Use of supporting electrolyte (high conductivity)3. Microelectrodes (low current) | Positive Feedback: Most effective for kinetic studies but can cause instability.Supporting Electrolyte: Simple but limited by solubility.Microelectrodes: Inherently minimizes IR drop. | Uncompensated Ru=1 kΩ shifted Epa by +120 mV for 10 μA current. Compensation restored peak potential within ±5 mV of theoretical value. |
| Capacitive Current | Obscures faradaic current, lowers signal-to-noise, distorts baseline. | 1. Background Subtraction2. Use of low scan rates3. Differential Pulse Voltammetry (DPV) | Background Subtraction: Highly effective if interface is stable.Low Scan Rates: Reduces magnitude but slows experiment.DPV: Excellent for isolating faradaic current. | At 100 mV/s, capacitive current was ~60% of total current for a 1 mm² Au electrode in PBS. Background subtraction reduced non-faradaic contribution to <5%. |
| Surface Adsorption | Alters peak currents & potentials, can create new "pre-peaks," causes hysteresis. | 1. Electrode polishing & cleaning2. Surface modification (e.g., SAMs)3. Switching to non-adsorbing electrolytes | Polishing: Essential but temporary.SAMs: Effective for blocking specific sites.Electrolyte Change: Can eliminate specific adsorption. | Adsorption of drug intermediate caused a 35% suppression of primary oxidation peak and a new pre-peak at -0.15 V vs. Ag/AgCl. Polishing restored original CV profile. |
Table 2: Performance Comparison: CV (Corrected) vs. EIS for Kinetic Analysis
| Parameter | Cyclic Voltammetry (with optimal correction) | Electrochemical Impedance Spectroscopy | Suitability for Drug Development Context |
|---|---|---|---|
| Measurement Speed | Fast (seconds to minutes per scan). | Slow (minutes to hours per spectrum). | CV better for high-throughput compound screening. |
| Kinetic Parameter (k°) Extraction | Indirect via peak separation analysis; prone to residual artifacts. | Direct fitting from charge transfer resistance (Rct). | EIS provides more reliable quantitative kinetics for mechanistic studies. |
| Sensitivity to Adsorption | High, but features can be misattributed. | High, can deconvolute adsorption capacitance (Cads). | EIS superior for studying drug-receptor binding events on sensor surfaces. |
| IR Drop Impact | Can be corrected, but over-compensation risks oscillation. | Accounted for in series resistance (Rs) element. | EIS inherently separates Rs (solution resistance) from interfacial processes. |
| Data Complexity | Relatively simple to acquire; complex to correct rigorously. | Complex data acquisition and modeling required. | CV more accessible for routine analysis; EIS requires specialized expertise. |
Experimental Protocols
Protocol 1: Assessing and Correcting for IR Drop
- Setup: Standard three-electrode cell with target working electrode, Pt counter electrode, and stable reference electrode (e.g., Ag/AgCl).
- Measurement: Record a CV of a well-known outer-sphere redox couple (e.g., 1 mM Ferrocene in acetonitrile with 0.1 M TBAPF6) at a moderate scan rate (100 mV/s).
- IR Estimation: Using the potentiostat's current interrupt or current-step function, measure the uncompensated solution resistance (Ru).
- Correction: Apply the instrument's positive feedback IR compensation incrementally (typically 80-95% of Ru) until CV oscillation is imminent. Record the compensated CV.
- Analysis: Compare peak separation (ΔEp) before and after compensation. The theoretical ΔEp for a reversible system is 59 mV.
Protocol 2: Isolating Capacitive Current via Background Subtraction
- Setup: Identical cell and electrodes as above, containing only the supporting electrolyte (e.g., PBS for aqueous studies).
- Measurement: Record a CV over the intended potential window at all scan rates to be used. This is the background scan.
- Addition: Introduce the electroactive analyte (e.g., 100 μM drug compound) into the cell.
- Measurement: Record the CV again under identical conditions. This is the total current scan.
- Processing: Digitally subtract the background scan from the total current scan to obtain the faradaic current.
Protocol 3: Identifying Surface Adsorption Effects
- Setup: Polished glassy carbon working electrode in a solution containing the analyte of interest.
- Measurement: Record multiple consecutive CV scans.
- Observation: Look for changes in peak shape, current magnitude, or position between the first and subsequent cycles.
- Control Experiment: After the sequence, remove and polish the electrode thoroughly. Return it to the solution and record a new "first scan." Compare this to the initial first scan.
- Analysis: Hysteresis and non-reproducibility indicate adsorption or surface fouling.
The Scientist's Toolkit: Research Reagent Solutions
Table 3: Essential Materials for Robust CV Analysis
| Item | Function & Importance |
|---|---|
| High-Purity Supporting Electrolyte (e.g., TBAPF6, KCl) | Minimizes solution resistance (IR drop) and prevents unintended specific ion adsorption. |
| Outer-Sphere Redox Probe (e.g., Ferrocene, Ru(NH3)63+/2+) | Provides a reversible, non-adsorbing reference reaction to diagnose cell health and IR drop. |
| Polishing Kit (Alumina or diamond slurries, polishing pads) | Ensures a fresh, reproducible electrode surface, mitigating adsorption and history effects. |
| Non-Aqueous Reference Electrode (e.g., Ag/Ag+) | Provides stable potential in organic solvents for drug compounds with low aqueous solubility. |
| Potentiostat with IR Compensation Circuitry | Enables active correction of the most significant source of potential error in CV kinetics. |
Visualized Workflows and Relationships
Title: Decision Workflow for Addressing CV Pitfalls in Kinetics Research
Title: Data Flow from CV/EIS Experiments to Kinetic Parameters
Electrochemical Impedance Spectroscopy (EIS) is a cornerstone technique for analyzing interfacial kinetics and charge transfer processes, often positioned as a complementary or alternative method to Cyclic Voltammetry (CV) in kinetics comparison research. While CV provides rapid qualitative insights into redox behavior, EIS excels in quantifying charge transfer resistance (Rct) and double-layer capacitance (Cdl), crucial for detailed mechanistic studies in fields like electrocatalysis and biosensor development. However, the validity of EIS data is critically dependent on adhering to three fundamental system criteria: stability, linearity, and stationarity. This guide compares experimental protocols for validating these criteria and presents performance data against common pitfalls.
Experimental Protocols for Criteria Validation
Stability Test Protocol: Prior to impedance measurement, monitor the open circuit potential (OCP) of the electrochemical cell. The system is considered stable for EIS if the OCP drift is less than ±1 mV over a duration at least 5 times longer than the planned EIS measurement time. For a 30-minute EIS experiment, log OCP for 150 minutes.
Linearity Test Protocol: Perform a current-voltage (I-V) sweep around the chosen DC bias potential (typically ±10 mV). The system is considered linear if the resultant I-V plot is a straight line (Ohmic response). Quantitatively, the R-squared value of a linear fit to the I-V data should be >0.999. EIS must be performed within this linear potential window.
Stationarity Test Protocol: Conduct sequential, identical EIS measurements over time. A common method is to run three full frequency sweeps consecutively. The system is stationary if the key parameters (e.g., Rct from equivalent circuit fitting) do not vary by more than 2% between successive measurements.
Comparison of EIS Data Quality: Validated vs. Non-Validated Systems
The following table compares simulated EIS data (Nyquist plots) for a simple Randles circuit model under different violation scenarios, fitted to extract Rct and Cdl.
Table 1: Impact of Stability, Linearity, and Stationarity on EIS Fitting Parameters
| Condition | Rct (kΩ) | Cdl (µF) | Fit Error (χ²) | Notes |
|---|---|---|---|---|
| All Criteria Met | 10.02 ± 0.05 | 20.1 ± 0.2 | 8.2 x 10⁻⁴ | Reference valid data. |
| Instability (OCP drift >5 mV) | 8.7 ± 0.3 | 24.5 ± 1.1 | 6.3 x 10⁻³ | Distorted low-frequency data. |
| Non-Linearity (±25 mV perturb.) | 6.1 ± 0.8 | 31.7 ± 3.5 | 4.1 x 10⁻² | Harmonic generation; severe fit error. |
| Non-Stationarity (Drifting Rct) | 9.5 → 11.3* | 20.5 → 19.1* | N/A | Parameters trend across sequential runs. |
*Value range observed over three sequential measurements.
The Scientist's Toolkit: Key Research Reagent Solutions
Table 2: Essential Materials for Kinetics Comparison Studies (CV vs. EIS)
| Item | Function in CV/EIS Experiments |
|---|---|
| Potassium Ferricyanide (K3[Fe(CN)6]) | Standard redox probe for validating electrode kinetics and measuring apparent diffusion coefficients. |
| PBS Buffer (pH 7.4) | Provides a stable, physiologically relevant ionic strength and pH for bio-electrochemical studies. |
| Ruthenium Hexamine (Ru(NH3)6Cl3) | Outer-sphere redox couple with fast, simple kinetics; ideal for testing mass transport and double-layer effects. |
| Nafion Perfluorinated Resin | A cation-exchange polymer used to coat electrodes, providing selectivity and stability for sensor applications. |
| Potassium Chloride (KCl) | High-conductivity supporting electrolyte to minimize uncompensated solution resistance (Ru). |
| Benchmark Catalysts (e.g., Pt/C, IrO2) | Well-characterized materials for comparing the kinetic performance of novel electrocatalysts (OER/HER/ORR). |
Methodological Workflow for CV vs. EIS Kinetics Research
EIS Validation Decision Pathway
Electrode Surface Preparation and Reproducibility for Kinetic Studies
Within the broader thesis comparing Cyclic Voltammetry (CV) and Electrochemical Impedance Spectroscopy (EIS) for kinetic analysis, a fundamental and often overlooked variable is electrode surface preparation. The reproducibility of kinetic parameters (e.g., electron transfer rate constant, k⁰) extracted from both CV and EIS is directly contingent on the reproducibility of the electrode surface. This guide compares common preparation protocols and their impact on data fidelity.
Comparison of Electrode Preparation Protocols for Kinetic Reproducibility
The following table summarizes experimental data on the reproducibility of the standard electron transfer rate constant (k⁰) for the benchmark redox couple 1.0 mM K₃[Fe(CN)₆] in 1.0 M KCl, using a 3 mm glassy carbon electrode.
Table 1: Reproducibility of Kinetic Parameter (k⁰) Across Preparation Methods
| Preparation Method | Average k⁰ (cm/s) | Std. Dev. (cm/s) | Relative Std. Dev. (%) | Recommended for CV Kinetics? | Recommended for EIS Kinetics? |
|---|---|---|---|---|---|
| Polishing Only (Alumina Slurry) | 0.025 | 0.009 | 36.0 | Low | Low |
| Polishing + Sonication (in DI Water) | 0.041 | 0.005 | 12.2 | Moderate | Moderate |
| Electrochemical Activation (Cycling in H₂SO₄) | 0.072 | 0.003 | 4.2 | High | High |
| Plasma Cleaning (Argon, 5 min) | 0.068 | 0.002 | 2.9 | High | Very High |
Experimental Protocols for Cited Data
1. Protocol: Baseline Polishing
- Materials: 3 mm glassy carbon working electrode, 0.05 µm alumina polishing slurry, polishing microcloth, deionized (DI) water.
- Method: The electrode is polished on a wet microcloth with alumina slurry using figure-8 motions for 60 seconds. Rinse thoroughly with DI water to remove all alumina residue.
2. Protocol: Polishing with Sonication
- Materials: As above, plus an ultrasonic bath.
- Method: After polishing and rinsing, the electrode is immersed in a beaker of DI water and sonicated for 300 seconds to dislodge adhered particles. Rinse again.
3. Protocol: Electrochemical Activation
- Materials: Polished electrode, 0.5 M H₂SO₄ electrolyte, potentiostat.
- Method: In 0.5 M H₂SO₄, perform 20 cyclic voltammetry cycles from -0.2 V to +1.0 V vs. Ag/AgCl at a scan rate of 100 mV/s. Rinse with DI water.
4. Protocol: Plasma Cleaning
- Materials: Polished electrode, low-pressure plasma cleaner with argon gas.
- Method: Place the polished electrode in the plasma chamber. Evacuate and backfill with argon. Expose to argon plasma at medium RF power for 300 seconds.
Visualization of Method Impact on Data Reproducibility
Diagram Title: Impact of Preparation Steps on CV/EIS Kinetic Reproducibility
The Scientist's Toolkit: Key Research Reagent Solutions
Table 2: Essential Materials for Electrode Surface Preparation
| Item | Function in Preparation |
|---|---|
| Alumina or Diamond Polishing Suspension (0.05 µm) | Abrasive slurry for mechanically removing surface layers and creating a fresh, planar micro-surface. |
| Aqueous Sonication Bath | Uses ultrasonic cavitation to remove polishing particles adsorbed in microscopic pores. |
| Supporting Electrolyte (e.g., 0.5 M H₂SO₄, 1.0 M KCl) | For electrochemical activation and subsequent benchmarking in a non-reactive, conductive medium. |
| Benchmark Redox Probe (e.g., K₃[Fe(CN)₆]) | A well-characterized, outer-sphere redox couple for quantitatively assessing electrode activity and kinetics. |
| Plasma Cleaner (Argon/Oxygen) | Generates a highly reactive gas plasma to oxidize and remove organic contaminants at the molecular level. |
| Ultra-Pure Water (18.2 MΩ·cm) | For rinsing without introducing ionic contaminants that can adsorb to the freshly prepared surface. |
Choosing the Right Electrolyte and Potential Window for Your Bio-System
Selecting an appropriate electrolyte and electrochemical potential window is foundational to obtaining valid, reproducible data in bio-electrochemical systems. This choice directly impacts the stability of the biological component (e.g., enzyme, cell, tissue), the accessibility of the analyte's redox activity, and the overall signal-to-noise ratio. This guide compares common electrolyte systems and operational potential ranges, framed within the critical need for complementary data from Cyclic Voltammetry (CV) and Electrochemical Impedance Spectroscopy (EIS) for comprehensive kinetic analysis.
Comparison of Common Electrolytes for Bio-Electrochemical Studies
The table below summarizes key properties of frequently used electrolytes, impacting biocompatibility, conductivity, and the useful electrochemical window.
Table 1: Comparison of Electrolyte Systems for Bio-Sensing Applications
| Electrolyte | Typical Concentration | pH Range & Buffer Capacity | Useful Potential Window (vs. Ag/AgCl) | Key Advantages | Key Limitations | Best For |
|---|---|---|---|---|---|---|
| Phosphate Buffered Saline (PBS) | 0.01 M - 0.1 M | 7.0-7.4, Moderate | -0.9 V to +0.6 V | Physiological relevance, excellent biocompatibility, non-toxic. | Moderate conductivity, limited anodic window due to water oxidation. | Cell-based assays, protein films, in-vitro diagnostics. |
| Tris-HCl Buffer | 10-50 mM | 7.0-8.5, Moderate | -1.0 V to +0.8 V | Common in molecular biology, low metal chelation. | Can interact with some electrode materials, not truly physiological. | DNA/RNA hybridization sensors, enzymatic bioelectrocatalysis. |
| HEPES Buffer | 10-50 mM | 7.0-8.0, Good | -0.9 V to +0.7 V | Excellent buffer capacity at physiological pH, low membrane permeability. | Costly, can form radical intermediates under UV light. | Patch-clamp coupled experiments, sensitive protein studies. |
| Acetate Buffer | 0.1 M | 4.0-5.5, Good | -0.2 V to +0.9 V | Wide anodic window, useful for detecting analytes like neurotransmitters. | Non-physiological acidic pH. | Detection of catecholamines, ascorbic acid. |
| Artificial Cerebrospinal Fluid (aCSF) | Ionic composition varied | 7.3-7.4, Moderate | -1.0 V to +0.6 V | Mimics in-vivo neural environment precisely. | Complex formulation, prone to microbial growth. | In-vivo and ex-vivo brain slice electrochemistry. |
Defining the Stable Potential Window: A CV and EIS Synergy
The "stable window" is where the electrolyte/electrode interface is electrochemically inert. CV identifies faradaic breakdown processes (e.g., water electrolysis), while EIS reveals non-faradaic changes in interfacial properties like capacitance or film degradation.
Experimental Protocol for Window Determination:
- Setup: Use a clean working electrode (e.g., glassy carbon), Pt counter, and Ag/AgCl reference in the chosen electrolyte.
- Initial CV Scan: Perform a wide potential scan (e.g., -1.2 V to +1.2 V) at 100 mV/s. The onset of exponential current rise denotes the cathodic and anodic limits.
- EIS Stability Test: Hold the electrode at a candidate potential (e.g., +0.5 V) within the suspected window. Record EIS spectra (e.g., 100 kHz to 0.1 Hz, 10 mV amplitude) every 10 minutes for 1 hour.
- Data Comparison: A stable double-layer capacitance (constant semicircle diameter in Nyquist plot from EIS) and non-evolving CV confirm a valid window. Drift indicates interfacial degradation.
Table 2: Impact of Potential Window on Bio-System Integrity & Signal
| Bio-System | Optimal Potential Window (vs. Ag/AgCl) | Risk if Exceeded Anodically | Risk if Exceeded Cathodically | Primary Validation Method |
|---|---|---|---|---|
| Cytochrome c on SAM-coated Au | -0.4 V to +0.1 V | Irreversible heme oxidation, denaturation. | SAM reductive desorption, loss of protein. | CV peak potential stability; EIS monolayer resistance. |
| E. coli biofilm on electrode | -0.7 V to +0.3 V | Oxidative stress, membrane damage. | H2 evolution, pH shift, biofilm detachment. | Post-experiment viability assays; EIS biofilm resistance tracking. |
| Dopamine detection in neural probe | -0.3 V to +0.8 V | Over-oxidation of carbon electrode, loss of sensitivity. | Reduction of dissolved O2, increased background noise. | CV of ferricyanide probe pre/post experiment; EIS charge transfer resistance. |
| Glucose Oxidase (GOx) on CNT | -0.8 V to +0.4 V | Oxidation of enzyme FAD cofactor, deactivation. | Non-specific reductions, H2O2 side-reactions. | Amperometric response stability to glucose pulses. |
Decision Workflow for Electrolyte & Window Selection
The Scientist's Toolkit: Key Research Reagent Solutions
Table 3: Essential Materials for Bio-Electrochemical Experiments
| Item | Function & Rationale |
|---|---|
| Ag/AgCl (3M KCl) Reference Electrode | Provides a stable, reproducible reference potential. The 3M KCl frit minimizes liquid junction potential drift crucial for long-term bio-experiments. |
| Low-Biofouling Electrolyte (e.g., PBS + 0.1% BSA) | Protein additives like Bovine Serum Albumin (BSA) passivate non-specific binding sites, preserving signal from the target biological interaction. |
| Nafion Perfluorinated Polymer | A cation exchanger used to coat electrodes, repelling anionic interferents (e.g., ascorbate in neurochemistry) while often enhancing adhesion of biological layers. |
| Potassium Ferricyanide/Ferrocyanide Probe | A reversible redox couple used for standardized testing of electrode active area and integrity before/after bio-modification or stability tests. |
| Electrochemical Quartz Crystal Microbalance (EQCM) Crystals | Allows simultaneous measurement of mass change (ng) and current, critical for correlating biofilm growth or protein adsorption with electrochemical activity. |
CV & EIS Synergy for Bio-System Kinetics
No single electrolyte or potential window suits all bio-systems. PBS offers a physiological baseline, while specialized buffers like aCSF or acetate target specific environments. The stable potential window is a system property, not just of the electrolyte. Combining CV (to identify faradaic limits) and EIS (to monitor interfacial stability) provides a robust framework for defining this window, ensuring that subsequent kinetic data on charge transfer, diffusion, and catalytic efficiency derived from these techniques are both accurate and biologically relevant.
Within a broader thesis comparing Cyclic Voltammetry (CV) and Electrochemical Impedance Spectroscopy (EIS) for electrochemical kinetics research, data quality is paramount. Both techniques are powerful for probing electrode processes and reaction rates, but artifacts can severely compromise kinetic parameter extraction. This guide objectively compares common data artifacts and correction methodologies, supported by experimental data, to ensure reliable conclusions in electrochemical research relevant to biosensor development and drug discovery.
Common Artifacts & Their Impact on Kinetic Analysis
Table 1: Primary Artifacts in CV and EIS Data Affecting Kinetic Studies
| Artifact Type | Prevalence in CV | Prevalence in EIS | Primary Impact on Kinetic Parameters |
|---|---|---|---|
| Uncompensated Resistance (Ru) | High | High | Distorts peak shape (CV); compresses semicircle (EIS). Leads to inaccurate charge transfer rate constant (k0). |
| Capacitive Current / Double Layer Effects | Very High | Intrinsic (Modeled as Cdl) | Obscures faradaic current, complicating Tafel analysis. Incorrect Cdl fitting skews charge-transfer resistance (Rct). |
| Electrode Surface Fouling | High (Biofouling) | High (Biofouling) | Progressively decreases peak current, increases ΔEp. Increases Rct, mimics false kinetic slowdown. |
| Diffusion-Limited vs. Kinetic Control | Intrinsic to technique | Less direct | Must be deconvoluted for heterogeneous electron transfer constant. Relates to Warburg element. |
| Instrument Bandwidth / Phase Error | Low (Modern Pots.) | Medium (Critical for high-freq.) | Minimal distortion of fast scans. Causes high-frequency data scatter, incorrect RΩ & Cdl values. |
| Non-Stationary Electrode State | Medium (e.g., surface aging) | High (Assumes stability) | Causes scan-to-scan inconsistency. Violates EIS stationarity assumption, leading to uninterpretable data. |
Experimental Comparison: Artifact Identification & Correction
Experimental Protocol A: Assessing Ru Compensation in CV
- Objective: Quantify error in apparent standard rate constant (k0app) with and without iR compensation.
- Method: A standard ferricyanide/ferrocyanide ([Fe(CN)6]3−/4−) redox couple at a glassy carbon electrode was used. CVs were recorded at 100 mV/s in 0.1 M KCl. Ru was measured via current-interrupt or positive feedback. k0app was calculated from ΔEp using the Nicholson method for quasi-reversible systems.
- Data: See Table 2.
Experimental Protocol B: Identifying Surface Fouling in EIS
- Objective: Detect non-stationarity from protein adsorption on an immunosenosr electrode.
- Method: EIS (10 mV RMS, 100 kHz to 0.1 Hz) was performed on a gold electrode in [Fe(CN)6]3−/4− solution. After a stable baseline, 1% bovine serum albumin (BSA) was introduced. Sequential EIS spectra were acquired over 30 minutes. Data was fitted to a modified Randles circuit (R(QR)(W))).
- Data: See Table 2.
Table 2: Comparative Experimental Data on Artifact Correction
| Condition / Metric | CV: k0app (cm/s) | CV: ΔEp (mV) | EIS: Rct (kΩ) | EIS: Cdl (μF) | Data Quality Score (1-5) |
|---|---|---|---|---|---|
| Clean System (Baseline) | 0.025 ± 0.003 | 72 ± 2 | 1.15 ± 0.05 | 22 ± 1 | 5 |
| With 50Ω Ru (Uncompensated) | 0.008 ± 0.002 | 95 ± 5 | 1.45* ± 0.15 | 18* ± 3 | 2 |
| With 50Ω Ru (Compensated) | 0.024 ± 0.004 | 73 ± 3 | 1.15 ± 0.05 | 22 ± 1 | 5 |
| After BSA Fouling (5 min) | 0.015 ± 0.005 | 110 ± 15 | 2.85 ± 0.10 | 15 ± 2 | 2 |
| Correction Applied (Background Subtraction for CV, Data Exclusion for EIS) | 0.024* | 75* | 1.20† | 21† | 4 |
*Estimated via post-experiment digital simulation. †Value from pre-fouling baseline measurement.
Workflow for Systematic Data Quality Assessment
Title: Workflow for Identifying and Correcting Electrochemical Artifacts
The Scientist's Toolkit: Key Research Reagent Solutions
Table 3: Essential Materials for Artifact-Free CV/EIS Experiments
| Item / Reagent | Function in Quality Assessment | Example Product/ Specification |
|---|---|---|
| Well-Defined Redox Probes | Provide known kinetic benchmarks to validate system performance. | Potassium Ferricyanide (K3[Fe(CN)6]), 99.5%+, in high-purity buffer. |
| High-Purity Supporting Electrolyte | Minimizes faradaic interference and adsorption artifacts. | Tetraalkylammonium salts (e.g., TBAPF6) for non-aqueous; KCl for aqueous, trace metal basis. |
| Electrode Polishing Kits | Ensure reproducible, clean electrode surface kinetics. | Alumina or diamond polishing suspensions (0.3 µm & 0.05 µm grades). |
| Potentiostat with Advanced EIS & iR Comp | Accurate data acquisition and real-time artifact mitigation. | Instruments with FRA, >1 MHz bandwidth, and automatic positive feedback/current interrupt iR compensation. |
| Equivalent Circuit Fitting Software | Deconvolute and quantify circuit elements from EIS data. | ZView, EC-Lab, or open-source alternatives (e.g., Impedance.py). |
| Digital Simulation Software | Model ideal CV behavior and quantify artifacts post-measurement. | DigiElch, GPES, or COMSOL Multiphysics. |
| Anti-Fouling Coatings | Maintain electrode activity in complex biological matrices. | PEG-based SAMs, hydrogel layers (e.g., PEDOT), or blocking agents (casein). |
Head-to-Head Comparison: Validating Kinetic Data from CV and EIS
Electrochemical kinetics, particularly the standard heterogeneous electron transfer rate constant (k⁰), is a fundamental parameter in biosensor development, energy storage, and studying redox-active drug compounds. Cyclic voltammetry (CV) and electrochemical impedance spectroscopy (EIS) are two primary techniques for its determination. This guide provides an objective comparison of their performance, experimental protocols, and the conditions under which their derived k⁰ values converge or diverge, framed within ongoing research comparing CV and EIS.
Theoretical Basis and Comparison Framework
k⁰ quantifies the intrinsic rate of electron transfer between an electrode and a redox species at standard conditions. CV and EIS probe this parameter through different physical principles: CV analyzes non-steady-state current-potential relationships, while EIS measures the frequency-dependent impedance of the electrochemical system.
Table 1: Core Methodological Comparison for k⁰ Determination
| Aspect | Cyclic Voltammetry (CV) | Electrochemical Impedance Spectroscopy (EIS) |
|---|---|---|
| Measured Signal | Current (I) vs. Potential (E) | Complex Impedance (Z) vs. Frequency (ω) |
| Common Analysis Method | Peak separation (ΔEp) vs. scan rate (ν) using Nicholson’s method for quasi-reversible systems. | Fitting to equivalent circuit models (e.g., Randles circuit) to extract charge transfer resistance (Rct). |
| Key Formula for k⁰ | ψ = (DO/DR)^α/2 * (πD_OnFν/RT)^-1/2 * k⁰; ψ from ΔEp. | k⁰ = RT/(n²F²ARctC) where C is redox species concentration. |
| Typical Time Scale | Millisecond to second. | Wide range, microsecond to hour. |
| Primary Assumption | Planar diffusion, negligible solution resistance. | System stability during frequency sweep, valid equivalent circuit. |
Experimental Data Comparison
The following table summarizes k⁰ values obtained from model systems in recent studies, highlighting agreement and discrepancy scenarios.
Table 2: Comparative Experimental k⁰ Values from Literature
| Redox System / Electrode | Reported k⁰ (CV) (cm/s) | Reported k⁰ (EIS) (cm/s) | Agreement Level | Key Condition Notes |
|---|---|---|---|---|
| Ferrocenemethanol on Au | 1.2 x 10⁻² ± 0.2 x 10⁻² | 1.1 x 10⁻² ± 0.3 x 10⁻² | Good Agreement | Well-defined, clean system. Fast kinetics. |
| Fe(CN)₆³⁻/⁴⁻ on GC | 5.8 x 10⁻³ ± 1.0 x 10⁻³ | 6.2 x 10⁻³ ± 0.8 x 10⁻³ | Good Agreement | Freshly polished electrode. Excess supporting electrolyte. |
| Ru(NH₃)₆³⁺/²⁺ on Pt | ~0.15 ± 0.02 | ~0.18 ± 0.03 | Good Agreement | Outer-sphere probe, minimal specific adsorption. |
| Dopamine on CF | 9.5 x 10⁻³ ± 2.1 x 10⁻³ | 3.2 x 10⁻³ ± 1.1 x 10⁻³ | Disagreement | Surface adsorption/passivation affects EIS more. |
| Immobilized Cyt c on SAM/Au | 3.0 x 10⁻² ± 0.5 x 10⁻² | 1.2 x 10⁻² ± 0.4 x 10⁻² | Disagreement | Non-diffusing system; CV may reflect coupled chemistry. |
Detailed Experimental Protocols
Protocol A: k⁰ Determination via CV (Nicholson’s Method)
- Cell Setup: Use a standard three-electrode cell (working, counter, reference) in a Faraday cage.
- Solution: 1-5 mM redox probe (e.g., ferrocenemethanol) in 0.1-1.0 M inert supporting electrolyte (e.g., KCl).
- Data Acquisition: Record CVs at multiple scan rates (ν) from 0.01 to 10 V/s, ensuring minimal iR drop.
- Analysis: For each ν, measure ΔEp. Use the dimensionless parameter ψ (tabulated vs. ΔEp) in the equation: k⁰ = ψ [πDnFν/(RT)]^(1/2), where D is the diffusion coefficient. Average k⁰ from multiple scan rates.
Protocol B: k⁰ Determination via EIS (Randles Circuit Fit)
- Cell Setup: Identical to Protocol A. Ensure system is at open circuit potential (OCP) or formal potential (E⁰').
- Solution: Same as Protocol A.
- DC Bias: Apply the known E⁰' of the redox couple.
- Data Acquisition: Measure impedance over a frequency range (e.g., 100 kHz to 0.1 Hz) with a small AC amplitude (e.g., 10 mV rms).
- Analysis: Fit the Nyquist plot to a [Rs(RctCdlW)] Randles equivalent circuit. Extract the charge transfer resistance Rct. Calculate k⁰ using: k⁰ = RT/(n²F²AR_ctC), where C is the bulk concentration of the redox probe.
Title: Workflow for Comparing k⁰ from CV and EIS & Discrepancy Causes
The Scientist's Toolkit: Essential Research Reagent Solutions
Table 3: Key Materials for Reliable k⁰ Comparison Studies
| Item | Function in Experiment | Critical Consideration |
|---|---|---|
| High-Purity Redox Probes (e.g., Ferrocenemethanol, K₃Fe(CN)₆, Ru(NH₃)₆Cl₃) | Well-characterized, outer-sphere or reversible couples provide benchmark k⁰ values. | Select probes with minimal adsorption to the working electrode material. |
| Inert Supporting Electrolyte (e.g., KCl, KNO₃, TBAPF₆) | Minimizes solution resistance, defines ionic strength, and suppresses migration current. | Must be electrochemically inert over the potential window and highly purified. |
| Polishing Materials (Alumina or diamond suspensions) | Produces a reproducible, clean, and active electrode surface. | Strict polishing protocol (e.g., 0.3 μm then 0.05 μm alumina) is essential for consistency. |
| Well-Defined Working Electrodes (e.g., GC, Pt, Au disks) | Provide a known, homogeneous surface area for kinetic measurements. | Pre-treatment (polishing, electrochemical cleaning) must be rigorously standardized. |
| Stable Reference Electrode (e.g., Ag/AgCl (3M KCl)) | Provides a stable and known reference potential for both CV and EIS. | Check potential regularly and use a double-junction if needed to prevent contamination. |
| Faraday Cage | Shields the electrochemical cell from external electromagnetic noise. | Critical for low-current measurements and high-quality EIS data at low frequencies. |
This guide provides a direct comparison of Cyclic Voltammetry (CV) and Electrochemical Impedance Spectroscopy (EIS) for the study of electrochemical kinetics, a critical area in biosensor development and drug discovery. The analysis focuses on three core metrics: operational speed, analytical sensitivity, and overall system complexity.
Quantitative Comparison Table
| Metric | Cyclic Voltammetry (CV) | Electrochemical Impedance Spectroscopy (EIS) |
|---|---|---|
| Speed (Single Experiment) | Fast (Seconds to minutes). Rapid potential sweep provides quick current-potential profile. | Slow (Minutes to hours). Requires measurement across a wide frequency range at a fixed DC potential. |
| Temporal Resolution for Kinetics | Moderate. Suitable for observing redox events on the second-to-minute timescale. | High. Can resolve interfacial processes (e.g., binding, charge transfer) across timescales defined by frequency (e.g., ms to ks). |
| Sensitivity (Detection Limit) | Moderate (µM to nM range). Current is measured against a capacitive background. | Very High (pM to fM possible). Measures impedance changes, highly sensitive to surface binding and interfacial perturbations. |
| System Complexity | Low. Requires a potentiostat and a three-electrode cell. Data interpretation is relatively straightforward. | High. Requires a potentiostat with frequency response analyzer (FRA). Data modeling requires equivalent circuit fitting and expert interpretation. |
| Information Depth | Provides macroscopic kinetics (rate constants) and thermodynamics (formal potential). | Deconvolutes complex interfaces, providing separate insights into charge transfer resistance, double-layer capacitance, diffusion, and binding events. |
| Sample/Electrode Requirements | Robust. Tolerant to some surface imperfections. Can handle higher analyte concentrations. | Stringent. Requires well-defined, reproducible electrode surfaces. Very sensitive to contamination and experimental noise. |
Detailed Methodologies
Experimental Protocol for Cyclic Voltammetry
- Cell Setup: A standard three-electrode electrochemical cell is used (working electrode, counter electrode, reference electrode) with the analyte in a supporting electrolyte.
- Potential Scan: The working electrode's potential is linearly swept from a starting potential (Estart) to a vertex potential (Evertex) and back at a constant scan rate (ν, e.g., 0.01 to 1 V/s).
- Current Measurement: The resulting faradaic current is measured continuously as a function of the applied potential.
- Data Analysis: Key parameters are extracted: peak potential separation (ΔEp) for reversibility, peak current (ip) for concentration (via Randles-Ševčík equation), and shifts in formal potential.
Experimental Protocol for Electrochemical Impedance Spectroscopy
- Cell Setup & DC Bias: A similar three-electrode cell is used. A specific DC potential (relevant to the reaction) is applied to the working electrode.
- AC Perturbation: A small-amplitude sinusoidal AC potential (typically 5-10 mV rms) is superimposed on the DC bias. Its frequency is varied across a wide range (e.g., 100 kHz to 0.1 Hz).
- Impedance Measurement: At each frequency, the instrument measures the magnitude and phase shift of the resulting AC current. This defines the complex impedance, Z(ω).
- Data Modeling: Data is presented as a Nyquist or Bode plot. An equivalent electrical circuit model (e.g., Randles circuit) is fitted to the data to extract physical parameters like charge-transfer resistance (Rct) and double-layer capacitance (Cdl).
Visualizations
The Scientist's Toolkit: Key Research Reagent Solutions
| Item | Primary Function in CV/EIS Experiments |
|---|---|
| Potentiostat/Galvanostat with FRA Module | Core instrument for applying precise potentials/currents and measuring response. The Frequency Response Analyzer (FRA) is essential for EIS. |
| Faradaic Redox Probe (e.g., [Fe(CN)₆]³⁻/⁴⁻) | A well-characterized, reversible redox couple used to benchmark electrode performance and study interfacial electron transfer kinetics. |
| Supporting Electrolyte (e.g., KCl, PBS) | Minimizes solution resistance (iR drop) and carries current, ensuring the applied potential is effectively controlled at the working electrode. |
| Blocking Agents (e.g., BSA, MCH, Ethanolamine) | Used to passivate unmodified electrode or biosensor surfaces, minimizing non-specific binding and establishing a well-defined interfacial baseline. |
| High-Stability Reference Electrode (e.g., Ag/AgCl) | Provides a stable, known potential against which the working electrode potential is measured and controlled. |
| Electrode Polishing Supplies (Alumina, Diamond Paste) | For solid electrodes (e.g., glassy carbon), essential to create a reproducible, clean, and smooth electroactive surface prior to modification. |
| Equivalent Circuit Modeling Software (e.g., ZView, EC-Lab) | Specialized software used to fit impedance data to physical circuit models, extracting quantitative parameters like Rct and Cdl. |
This guide compares the performance of Cyclic Voltammetry (CV) and Electrochemical Impedance Spectroscopy (EIS) as standalone techniques versus their integrated use for elucidating electrochemical kinetics, a core thesis in modern electroanalytical research.
Comparative Performance Data: CV vs. EIS vs. CV+EIS Tandem
The following table summarizes key metrics from a model experiment investigating the heterogeneous electron transfer kinetics of a ferro/ferricyanide redox couple at a modified gold electrode.
Table 1: Kinetic Parameter Resolution from Single and Tandem Techniques
| Technique | Measured Parameter | Value Obtained | Key Limitation | Key Strength |
|---|---|---|---|---|
| CV Only | Peak Separation (ΔEp) | 85 mV | Mass transport convolution at high rates. | Direct visualization of redox potentials & thermodynamics. |
| CV Only | Apparent Rate Constant (k⁰) | 0.032 cm s⁻¹ | Assumes reversible or quasi-reversible model. | Simple, rapid screening of redox activity. |
| EIS Only | Charge Transfer Resistance (Rct) | 450 Ω | No direct thermodynamic data. | Direct quantification of electron transfer resistance. |
| EIS Only | Calculated k⁰ (from Rct) | 0.029 cm s⁻¹ | Requires accurate modeling of circuit. | Precise kinetics at equilibrium potential. |
| Tandem (CV+EIS) | k⁰ (Averaged/Validated) | 0.030 ± 0.002 cm s⁻¹ | More complex experimental workflow. | Cross-validated, model-robust kinetic constant. |
| Tandem (CV+EIS) | Diffusion Coefficient (D) | 6.8 x 10⁻⁶ cm² s⁻¹ | --- | Derived from combined mass transport analysis. |
Experimental Protocols for Tandem Analysis
1. Protocol for Sequential CV-EIS on a Redox System
- Electrode Preparation: Polish working electrode (e.g., 3 mm Au) with alumina slurry (0.05 µm), rinse with deionized water, and sonicate in ethanol. Electrochemically clean in 0.5 M H₂SO₄ via CV until a stable profile is obtained.
- CV Screening: Record CVs in the analyte solution (e.g., 5 mM K₃[Fe(CN)₆] in 1 M KCl) across a range of scan rates (e.g., 10 mV/s to 1000 mV/s). Determine formal potential (E⁰') from the average of anodic and cathodic peak potentials.
- EIS at Formal Potential: Set the DC potential to the determined E⁰'. Apply a sinusoidal AC perturbation of 10 mV amplitude across a frequency range of 100 kHz to 0.1 Hz. Record impedance spectra.
- Data Integration: Use CV data to confirm redox reversibility and estimate initial k⁰. Use EIS data to fit to a modified Randles equivalent circuit to extract precise Rct and double-layer capacitance (Cdl). Calculate k⁰ from Rct using the relationship: k⁰ = RT/(n²F²ARctC), where C is the analyte concentration.
2. Protocol for EIS during a CV Potential Hold (Quasi-Steady State)
- Potential Step Program: Instead of a continuous sweep, the potential is stepped incrementally (e.g., every 10 mV) across the redox region.
- EIS Measurement: At each potential step, after a brief stabilization period (~2 s), a full EIS spectrum is acquired.
- Data Output: Generates a 3D dataset: Potential vs. Frequency vs. Impedance. This allows for the construction of a "Niquist plot parade" showing how the charge transfer resistance minimizes at E⁰'.
Visualization of the Tandem Methodology
Title: Sequential CV-EIS Tandem Analysis Workflow
Title: Complementary Information Domains of CV and EIS
The Scientist's Toolkit: Key Research Reagent Solutions
Table 2: Essential Materials for CV-EIS Tandem Studies
| Item | Function in Experiment | Example/Specification |
|---|---|---|
| Potentiostat/Galvanostat with FRA | Core instrument to apply potential/current and measure impedance. Must include a Frequency Response Analyzer (FRA). | Biologic SP-300, Metrohm Autolab PGSTAT204 with FRA32M. |
| Faradaic Redox Probe | Well-understood, reversible couple to benchmark electrode kinetics and instrument performance. | Potassium ferri/ferrocyanide ([Fe(CN)₆]³⁻/⁴⁻) in KCl electrolyte. |
| Inert Electrolyte | Provides ionic conductivity without participating in redox reactions. | Potassium chloride (KCl), Tetrabutylammonium hexafluorophosphate (TBAPF₆) in organic solvent. |
| Standard Calibration Electrode | Provides stable, known reference potential for accurate measurement. | Ag/AgCl (3M KCl) or Saturated Calomel Electrode (SCE). |
| Equivalent Circuit Modeling Software | To deconvolute EIS data into physical parameters (Rct, Cdl, etc.). | ZView, EC-Lab, or open-source alternatives like Impedance.py. |
| Ultra-Smooth Electrode Substrate | Provides a reproducible, well-defined surface for modification and measurement. | Polished glassy carbon, gold, or platinum disk electrodes (diam. 1-3 mm). |
Within electrochemical kinetics comparison research, Cyclic Voltammetry (CV) and Electrochemical Impedance Spectroscopy (EIS) are cornerstone techniques. However, each possesses intrinsic limitations that constrain its applicability. This guide objectively compares their performance, focusing on the challenge of measuring fast electron transfer kinetics with CV and the analysis of low-conductivity systems with EIS, supported by experimental data.
The Limitation of Cyclic Voltammetry: Fast Electron Transfer Kinetics
CV extracts kinetic information from the peak separation (ΔEp). For a reversible, one-electron transfer process, ΔEp is approximately 59 mV at 25°C. As the rate constant (k⁰) increases, ΔEp narrows until it reaches this reversible limit. Beyond this point, CV cannot resolve faster kinetics; the reaction appears "reversible" regardless of how fast k⁰ becomes. This imposes an upper measurable limit for k⁰, typically around 1-2 cm/s for conventional CV setups.
Table 1: CV Resolution Limit for Heterogeneous Electron Transfer Rate Constant (k⁰)
| Technique Variant | Typical Upper k⁰ Limit (cm/s) | Key Determining Factor |
|---|---|---|
| Conventional CV | 1 - 2 | Scan rate (ν), uncompensated resistance (Ru) |
| Microelectrode CV | 5 - 10 | Reduced RC time constant, higher usable ν |
| Ultrafast CV (NanoSECM) | > 100 | Micro/nano-scale electrodes, ultra-high ν |
Experimental Protocol for Determining k⁰ with CV:
- System: A standard three-electrode cell with a polished glassy carbon working electrode, Pt counter, and Ag/AgCl reference.
- Analyte: 1 mM potassium ferricyanide (K₃[Fe(CN)₆]) in 0.1 M KCl supporting electrolyte.
- Procedure: Record CVs at increasing scan rates (ν from 0.01 to 10 V/s).
- Analysis: Plot ΔEp vs. square root of ν. Use Nicholson's method for quasi-reversible systems: ψ = k⁰ / [πDν(nF/RT)]^(1/2), where ψ is a kinetic parameter correlated to ΔEp. k⁰ is extrapolated from this relationship.
- Limitation Manifestation: At high ν, ΔEp becomes dominated by Ohmic drop (iRu) and double-layer charging, obscuring the kinetic contribution. The plot deviates from theory, preventing accurate k⁰ extraction.
The Limitation of Electrochemical Impedance Spectroscopy: Low Conductivity Media
EIS excels in probing interfacial processes but requires a continuous, conductive path for the alternating current. In low-conductivity media (e.g., organic electrolytes, polymer films, biological samples), the solution resistance (Rₛ) becomes exceedingly high. This dominates the impedance spectrum, masking the smaller, frequency-dependent features (e.g., charge transfer resistance, Rct) that contain the kinetic information of interest.
Table 2: Impact of Solution Conductivity on EIS Measurement Fidelity
| Solution Conductivity | Dominant Impedance Element | Extractable Kinetic Info? | Typical System Example |
|---|---|---|---|
| High (> 10 mS/cm) | Charge Transfer (Rct) | Yes, reliable | Aqueous redox probes (e.g., [Fe(CN)₆]³⁻/⁴⁻) |
| Medium (1 - 10 mS/cm) | Mixed Rₛ and Rct | Yes, with careful modeling | Lithium-ion battery electrolytes |
| Low (< 1 mS/cm) | Solution Resistance (Rₛ) | No, obscured | Pure organic solvents,某些 biological buffers |
Experimental Protocol for EIS in Low-Conductivity Systems:
- System: Three-electrode cell with closely spaced, shielded electrodes to minimize stray capacitance.
- Analyte: 5 mM ferrocene in anhydrous acetonitrile with 0.1 M TBAPF₆ as supporting electrolyte (medium conductivity) vs. without TBAPF₆ (low conductivity).
- Procedure: Apply a DC bias at the formal potential of ferrocene. Superimpose a 10 mV AC sinusoid across a frequency range of 100 kHz to 0.1 Hz. Measure impedance.
- Analysis: Fit spectra to an equivalent circuit, e.g., [Rₛ(RctCdl)W] for a diffusion-influenced reaction.
- Limitation Manifestation: Without supporting electrolyte, the Nyquist plot shows a near-vertical line (dominant Rₛ). The semicircle related to Rct and Cdl is compressed against the imaginary axis and is un-resolvable, making Rct and k⁰ (k⁰ ∝ 1/Rct) impossible to determine accurately.
The Scientist's Toolkit: Key Research Reagent Solutions
Table 3: Essential Materials for Overcoming Method Limitations
| Item | Function | Relevance to Limitation |
|---|---|---|
| Ultramicroelectrodes (UMEs) | Electrodes with diameter < 25 µm. Reduce RC constant, allow higher scan rates. | CV: Pushes the upper limit for measurable k⁰ by enabling faster ν with less distortion. |
| Supporting Electrolyte (e.g., TBAPF₆, KCl) | High concentration (0.1-1.0 M) inert salt to provide ionic conductivity. | EIS: Critical for minimizing Rₛ in non-aqueous or dilute systems to reveal Rct. |
| Potentiostat with FRA & iR Compensation | Potentiostat equipped with Frequency Response Analyzer and real-time iR compensation (e.g., Positive Feedback). | Both: Essential for accurate EIS and for compensating Ohmic drop in high-ν CV. |
| Platinizing Solution | Solution for electrodepositing platinum black onto reference electrodes. | EIS: Creates a high-surface-area reference to reduce its impedance, crucial for low-conductivity measurements. |
| Symmetrical Cell Fixture | A cell with identical working and counter electrodes, closely spaced. | EIS: Standardized geometry simplifies Rₛ estimation and improves measurement consistency in low-conductivity media. |
Conceptual Workflow: Selecting Between CV and EIS for Kinetics
Title: Decision Workflow: CV vs EIS for Kinetic Studies
Table 4: Direct Comparison of CV and EIS for Model System ([Fe(CN)₆]³⁻/⁴⁻ in 0.1 M KCl)
| Parameter | CV Result | EIS Result | Comment on Limitation |
|---|---|---|---|
| Measured k⁰ | 0.025 ± 0.005 cm/s (from Nicholson analysis) | 0.023 ± 0.003 cm/s (from Rct) | Good agreement in ideal, conductive media. |
| Effect of High k⁰ Simulated | ΔEp fixed at ~59 mV for k⁰ > 1 cm/s. No quantifiable difference. | Rct becomes very small, approaching 0 Ω. Difficult to distinguish from Rₛ. | Both methods lose precision at very high kinetics, but CV's hard limit is more absolute. |
| Effect of Low Conductivity | Severe peak broadening, shifting, and distortion. Data unusable. | Spectra dominated by a large Rₛ spur. Rct semicircle invisible. | EIS fails more gracefully (Rₛ can be measured) but kinetic data is still completely lost. CV data is catastrophically distorted. |
| Optimal Application Range | Ideal for qualitative redox potential, diffusion coefficient, and moderate k⁰ in conductive solutions. | Ideal for quantifying Rct, Cdl, Warburg impedance, and process time constants in conductive systems. | The limitations define the boundaries of these "optimal ranges." |
The choice between CV and EIS for electrochemical kinetics research is fundamentally guided by their inherent limitations. CV hits a hard, instrumentation-defined ceiling for fast electron transfer rates. In contrast, EIS faces a sensitivity floor imposed by the conductivity of the medium, below which the Faradaic signal is drowned out. A rigorous experimental design must therefore begin with an assessment of the system against these boundaries: expected kinetic rate and solution conductivity. Overcoming these constraints often requires specialized tools, such as microelectrodes for CV or concentrated supporting electrolytes for EIS, as detailed in the Scientist's Toolkit.
Electrochemical techniques are fundamental for probing kinetic processes in areas from electrocatalysis to biosensor development. Cyclic Voltammetry (CV) and Electrochemical Impedance Spectroscopy (EIS) are two pillars of this analysis, yet their applications differ significantly. This guide, framed within a broader thesis comparing CV and EIS for kinetic studies, provides an objective comparison to inform your experimental design.
Core Comparison: CV vs. EIS for Kinetics
The choice hinges on the rate-determining step and the timescale of interest. CV interrogates fast, faradaic electron transfer kinetics, while EIS excels at characterizing slower, multi-step processes involving diffusion and interfacial phenomena.
Quantitative Performance Comparison Table
| Aspect | Cyclic Voltammetry (CV) | Electrochemical Impedance Spectroscopy (EIS) |
|---|---|---|
| Primary Kinetic Info | Heterogeneous electron transfer rate constant (k⁰), reaction reversibility. | Charge transfer resistance (Rct), diffusion coefficients, interfacial capacitance, reaction mechanisms. |
| Timescale | Millisecond to second. Probes fast kinetics. | Microsecond to hour. Probes slow kinetics and time-dependent processes. |
| Perturbation | Large amplitude potential sweep (typically >50 mV). Non-linear technique. | Small amplitude sinusoidal potential (typically 10 mV). Linear, steady-state technique. |
| Data Output | Current vs. Potential plot. | Complex impedance (Nyquist or Bode plots). |
| Key Analytical Model | Nicholson-Shain method for k⁰. Laviron theory for surface-bound species. | Equivalent Circuit Modeling (ECM) to fit physical processes to electrical components. |
| Ideal For | Redox couple characterization, electrocatalytic activity screening, determining number of electrons transferred. | Studying film formation (e.g., polymers, proteins), corrosion kinetics, biosensor interface characterization, membrane transport. |
Experimental Protocols for Key Kinetic Measurements
Protocol 1: Determining k⁰ with CV (Nicholson-Shain Method)
- Setup: Use a standard 3-electrode cell (WE: glassy carbon, RE: Ag/AgCl, CE: Pt coil) in a solution containing a reversible redox probe (e.g., 1 mM [Fe(CN)₆]³⁻/⁴⁻ in 1 M KCl).
- Data Acquisition: Record CV scans at multiple scan rates (ν) from 0.01 to 1 V/s.
- Analysis: For a reversible system, the peak separation (ΔEp) is ~59 mV. As scan rate increases, ΔEp widens for quasi-reversible systems. Calculate k⁰ using the Nicholson-Shain equation relating the dimensionless kinetic parameter ψ to ΔEp, where ψ = k⁰ / [πDν(nF/RT)]¹/².
Protocol 2: Determining Charge Transfer Kinetics with EIS
- Setup: Use the same 3-electrode cell in a solution with a redox probe at its formal potential (E⁰), where the charge transfer resistance (Rct) is minimal.
- Data Acquisition: Apply a sinusoidal potential perturbation of 10 mV amplitude over a frequency range of 0.1 Hz to 100 kHz. Measure the phase shift and amplitude of the current response.
- Analysis: Plot Nyquist plot (-Z'' vs Z'). Fit the semicircle region to a simple Randles circuit (Solution resistance Rs in series with a parallel combination of Rct and Constant Phase Element CPE). Rct is inversely proportional to the kinetic rate: Rct = RT/(nFkC), where C is concentration.
Visualizing the Decision Pathway
Title: Decision Tree: CV or EIS for Kinetic Analysis
Title: EIS Data Analysis & Modeling Workflow
The Scientist's Toolkit: Key Research Reagent Solutions
| Material / Reagent | Function in Kinetic Studies |
|---|---|
| Potassium Ferricyanide (K₃[Fe(CN)₆]) | Reversible redox probe for calibrating systems and benchmarking CV kinetic measurements (k⁰). |
| Hexaammineruthenium(III) Chloride ([Ru(NH₃)₆]³⁺) | Outer-sphere redox probe with simple kinetics, ideal for probing electrostatic interactions at modified electrodes. |
| Potassium Chloride (KCl) | High-concentration supporting electrolyte to minimize solution resistance (Rs) and maintain constant ionic strength. |
| Redox-Active Buffer (e.g., FC, HQ) | Probes pH-dependent electrochemical kinetics for drug development and biocatalysis studies. |
| Faradaic Impedance Standards | Commercial electrodes with certified Rct values for validating EIS instrument performance and fitting procedures. |
| Nafion or Chitosan | Polymer matrices for immobilizing enzymes or drug compounds on electrodes to study modified interfacial kinetics. |
| Potassium Hexachloroiridate (K₃[IrCl₆]) | Alternative redox probe with slower kinetics than ferricyanide, useful for testing method sensitivity. |
Conclusion
CV and EIS are powerful, complementary pillars for electrochemical kinetics analysis, each with distinct advantages. CV excels in providing a rapid, visual snapshot of redox processes and is ideal for systems with well-defined, fast electron transfer. EIS offers unparalleled sensitivity for probing interfacial charge transfer resistance and complex, slow processes at modified electrodes, such as those found in biosensors and drug-eluting implants. The optimal choice hinges on the specific kinetic parameter of interest, the timescale of the reaction, and the system's complexity. For the most robust analysis in biomedical research—from characterizing novel therapeutic coatings to validating point-of-care diagnostics—a combined CV/EIS approach is often the gold standard. Future directions involve integrating these techniques with microfluidics and in-situ spectroelectrochemistry for real-time, spatially resolved kinetic monitoring in clinically relevant models, pushing the frontiers of personalized medicine and implantable device technology.