Advanced Cell Design: A Comprehensive Protocol for Minimizing Electrode Spacing to Enhance Signal Fidelity and Assay Sensitivity
This article provides a detailed, step-by-step protocol for minimizing electrode spacing in cell-based assay design, targeting researchers, scientists, and drug development professionals.
Advanced Cell Design: A Comprehensive Protocol for Minimizing Electrode Spacing to Enhance Signal Fidelity and Assay Sensitivity
Abstract
This article provides a detailed, step-by-step protocol for minimizing electrode spacing in cell-based assay design, targeting researchers, scientists, and drug development professionals. We first explore the fundamental principles of electric field distribution, impedance sensing, and the critical link between electrode proximity and signal-to-noise ratio (SNR). A core methodological section delivers a practical guide for fabrication, surface chemistry, and cell positioning. We then address common troubleshooting scenarios and optimization strategies for cell health, edge effects, and manufacturability. Finally, we present validation frameworks and comparative analyses against conventional designs, focusing on metrics for electrophysiology, impedance-based monitoring, and high-content screening applications.
The Science of Proximity: Why Electrode Spacing is Critical for Cellular Electrophysiology and Biosensing
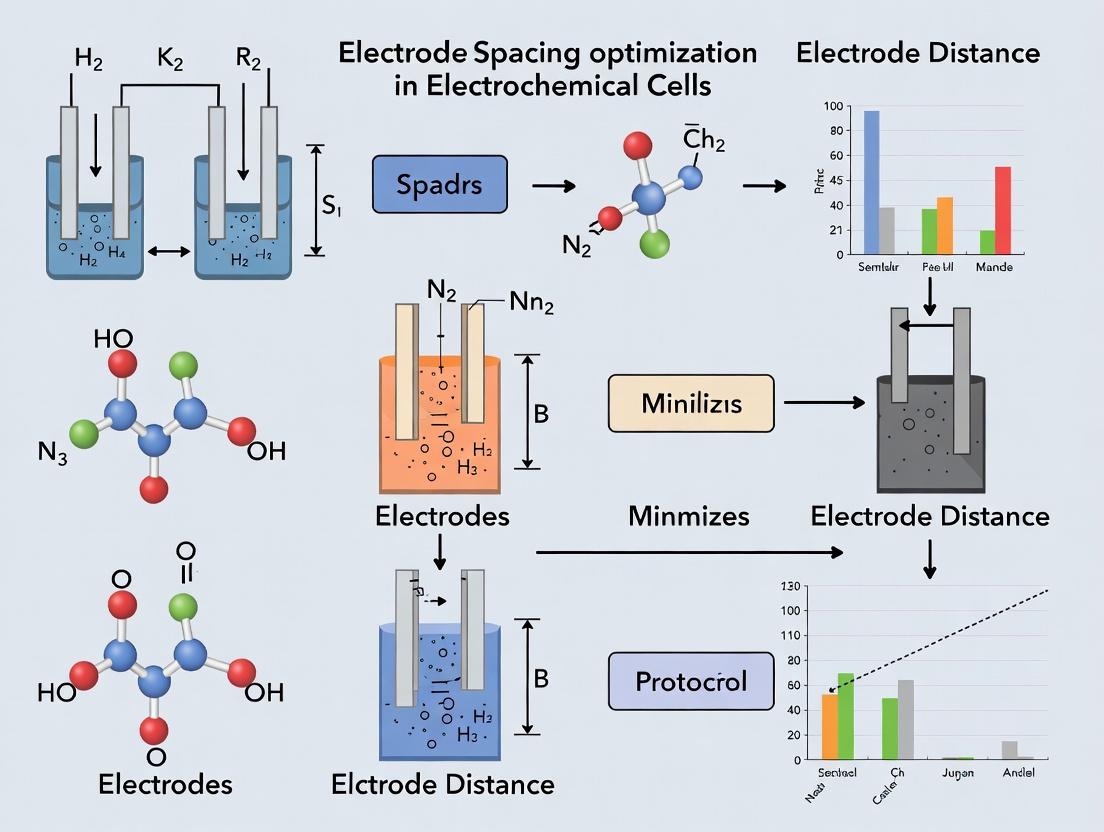
Electrode spacing, defined as the center-to-center distance between working and counter/reference electrodes in an electrochemical or electrophysiological cell, is a critical but often overlooked design parameter. Within the broader thesis of minimizing electrode spacing in cell design research, this protocol establishes that reducing this distance (typically from the mm-scale to the µm-scale) fundamentally enhances key assay metrics by decreasing solution resistance, improving signal-to-noise ratio, and enabling higher temporal resolution. This application note provides validated protocols for quantifying these impacts.
Table 1: Impact of Electrode Spacing on Key Electrochemical Assay Metrics
| Assay Metric | Electrode Spacing: ~5 mm | Electrode Spacing: ≤ 200 µm | Primary Mechanism of Improvement |
|---|---|---|---|
| Solution Resistance (Rs) | High (kΩ range) | Low (tens of Ω) | Reduced Ohmic drop (iR) in bulk solution. |
| Time Constant (τ=RsCd) | High (ms-s) | Low (µs-ms) | Faster system response & settling time. |
| Signal-to-Noise Ratio (SNR) | Lower | Higher (≤50% increase) | Reduced Johnson/Nyquist thermal noise. |
| Limiting Current (Il) | Diffusion-limited | Enhanced (up to 2x) | Steeper concentration gradient. |
| Voltage Accuracy | Reduced by iR drop | High (minimal iR error) | Potential sensed is closer to applied. |
Experimental Protocol 1: Quantifying Impact on Cyclic Voltammetry (CV) Metrics
Objective: To measure the reduction in solution resistance (Rs) and time constant (τ) achieved by minimized electrode spacing. Materials: Potentiostat, microfabricated electrode chips with integrated spacing (e.g., 200 µm & 5 mm), Ag/AgCl reference, platinum counter, 5 mM Potassium Ferricyanide (K3[Fe(CN)6]) in 1M KCl. Procedure:
- Setup: Place electrode chip in Faraday cage. Connect potentiostat leads to respective pads (working, counter, reference).
- Solution Preparation: Prepare 10 mL of 5 mM K3[Fe(CN)6] in 1M KCl electrolyte. Degas with nitrogen for 10 minutes.
- Electrochemical Impedance Spectroscopy (EIS): Apply a 10 mV RMS sinusoidal perturbation from 100 kHz to 1 Hz at the open circuit potential.
- Data Analysis: Fit EIS data to a modified Randles circuit. Record the series resistance (Rs) value.
- Cyclic Voltammetry: Perform CV at 100 mV/s scan rate from +0.6 V to -0.1 V.
- Calculation: Determine the peak separation (ΔEp). Calculate the effective time constant τ = Rs * Cd (double-layer capacitance).
- Repeat: Perform steps 3-6 for all electrode spacing configurations. Expected Outcome: The 200 µm spacing will show a significantly lower Rs and ΔEp, confirming reduced iR drop and faster electrochemical kinetics.
Experimental Protocol 2: Assessing SNR Improvement in Amperometric Detection
Objective: To demonstrate enhanced Signal-to-Noise Ratio (SNR) for dopamine detection using reduced electrode spacing. Materials: Potentiostat, carbon-fiber microelectrode (working), miniature Ag/AgCl wire (reference/counter) placed at 50 µm and 2 mm spacing, 1X PBS, 1 µM Dopamine in PBS, flow-injection system. Procedure:
- Cell Assembly: Align reference/counter electrode at specified distances from the carbon working electrode using a micromanipulator.
- Bias Application: Apply +0.7 V vs. Ag/AgCl to the working electrode in flowing PBS. Allow current to stabilize (~10 min).
- Baseline Recording: Record amperometric current for 60 s to establish noise level (RMS noise).
- Solute Injection: Inject 50 µL of 1 µM dopamine solution into the PBS flow stream.
- Signal Measurement: Record peak current amplitude (Signal) upon dopamine arrival.
- SNR Calculation: Calculate SNR as (Peak Current) / (RMS Baseline Noise).
- Repeat: Perform 5 injections for each spacing configuration. Statistically compare mean SNR values. Expected Outcome: The 50 µm spacing configuration will yield a statistically higher mean SNR due to reduced thermal noise and improved charge transfer efficiency.
Diagram 1: Signal Pathway: Minimized Electrode Spacing
Diagram 2: Protocol Workflow for Comparative CV & EIS
The Scientist's Toolkit: Key Research Reagent Solutions
| Item | Function & Relevance to Minimized Spacing |
|---|---|
| Microfabricated Electrode Chips | Provide precise, lithographically-defined electrode spacing (µm-scale) essential for controlled experiments. |
| Potassium Ferricyanide (K3[Fe(CN)6]) | Reversible redox probe for benchmarking electrode kinetics and quantifying iR drop via CV peak separation. |
| High Purity KCl (1M Solution) | Provides inert, high-conductivity supporting electrolyte to minimize Rs from ionic strength. |
| Miniaturized Ag/AgCl Wire | Enables construction of integrated, low-profile reference electrodes for close spacing configurations. |
| Carbon-Fiber Microelectrode | Small diameter (5-7 µm) working electrode for high spatial resolution in amperometric SNR assays. |
| Fast-Scan Cyclic Voltammetry (FSCV) Potentiostat | Required for exploiting the high temporal resolution enabled by low τ from minimized spacing. |
| Degassed Buffer Solutions | Removes oxygen, an electrochemical interferent, to ensure clean baseline for noise measurements. |
This document provides application notes and protocols within the broader thesis objective of minimizing electrode spacing in cell-based assay design. The fundamental biophysics of electric field (E-field) penetration and current density distribution in electrolyte environments directly dictates the spatial resolution and signal fidelity achievable in electrophysiological measurements. Optimizing electrode spacing requires a precise understanding of signal attenuation with distance to maximize signal-to-noise ratio while minimizing cross-talk.
Theoretical Framework & Quantitative Data
Key Principles
- Electric Field Penetration: In a conductive biological medium, an applied electric field decays due to capacitive charging of the double layer and ohmic losses. The penetration depth is frequency-dependent.
- Current Density (J): The current per unit area (A/m²). It dissipates radially from a point source, governing the spatial extent of stimulation or recording.
- Signal Attenuation: The reduction in recorded potential (V) with distance (r) from a current source in a volume conductor.
The following table summarizes key quantitative relationships for point sources in homogeneous media.
Table 1: Quantitative Models for Field and Potential Attenuation
| Model/Principle | Governing Equation | Key Variables | Implication for Electrode Spacing |
|---|---|---|---|
| DC Point Source (Ohmic) | V(r) = (ρ I) / (4 π r) | V: Potential (V), ρ: Resistivity (Ω·m), I: Current (A), r: Distance (m) | Potential falls off with 1/r. Close spacing is critical for measurable DC signals. |
| AC Point Source (Frequency Dependent) | V(r,ω) ∝ (exp(-r/δ)) / r ; δ = 1/√(π f μ σ) | δ: Skin depth (m), f: Frequency (Hz), μ: Permeability (H/m), σ: Conductivity (S/m) | High-frequency signals attenuate rapidly (skin effect). Low-frequency signals penetrate further. |
| Current Density from Point Electrode | J(r) = I / (2 π r²) (for hemisphere) | J: Current density (A/m²) | Current density falls with 1/r². Stimulation is highly localized near the electrode. |
| Typical Cell Culture Resistivity | 50 - 150 Ω·cm | Measured for standard DMEM + serum at 37°C | Sets the baseline for ρ in the above equations. |
Application Notes for Minimizing Electrode Spacing
Note 1: Estimating Crosstalk Threshold
To prevent cross-talk between adjacent recording channels, the potential from a neighboring stimulating electrode must fall below the noise floor. For a target noise floor of Vmin, the minimum center-to-center electrode spacing (dmin) can be estimated from the DC model: dmin > (ρ Istim) / (4 π Vmin) *Example:* For ρ=1 Ω·m, Istim=100 nA, Vmin=10 µV, dmin must be > ~800 µm. Reducing Istim to 10 nA allows dmin > ~80 µm.
Note 2: Spatial Resolution Limit for Recording
The spatial resolution for detecting localized cellular activity is governed by the distance at which the signal from a single cell (modeled as a dipole or point current source) becomes indistinguishable from noise. Closer electrode spacing improves the probability of recording high-fidelity, single-unit activity.
Experimental Protocols
Protocol 1: Measuring Media Resistivity for Modeling
Objective: Determine the resistivity (ρ) of the specific cell culture medium used in your assay to enable accurate modeling of field penetration. Materials: (See Scientist's Toolkit) Workflow:
- Calibrate the conductivity meter using standard solutions.
- Warm the cell culture medium to 37°C in a water bath.
- Gently agitate the medium bottle to ensure homogeneity.
- Immerse the conductivity probe in the medium, ensuring no air bubbles are trapped.
- Record the conductivity (σ) value in S/m once stable.
- Calculate resistivity: ρ = 1/σ.
- Perform three independent measurements and average.
Protocol 2: Empirical Characterization of Signal Attenuation with Microelectrode Arrays (MEAs)
Objective: Empirically map the attenuation of electrical potential as a function of distance from a point current source on your specific MEA setup. Materials: (See Scientist's Toolkit) Workflow:
- Setup: Fill the MEA dish with culture medium. Place the MEA in the amplifier.
- Source Electrode Selection: Designate one electrode as the stable point current source.
- Stimulation: Inject a biphasic, constant-current pulse (e.g., 10 µA, 1 ms phase) via the source electrode.
- Recording: Simultaneously record the voltage transient on all other electrodes of the array.
- Data Extraction: For each recording electrode (at distance r), measure the peak-to-peak voltage amplitude (V_pp).
- Analysis: Plot V_pp versus distance r. Fit the data to the model V(r) = k / r (or a more complex model including frequency components). The fit parameter k can be compared to the theoretical (ρI)/(4π).
Title: Workflow for Empirical Attenuation Measurement
Protocol 3: Determining Minimum Spacing for Stimulation Isolation
Objective: Establish the minimum electrode spacing required to achieve confined stimulation of a single cell without activating neighbors. Materials: (See Scientist's Toolkit) Workflow:
- Cell Preparation: Seed a sparse layer of excitable cells (e.g., cardiomyocytes, neurons) on the MEA.
- Identify Target: Locate a solitary cell over one electrode (Electrode A).
- Stimulation & Response: Deliver a threshold current pulse via Electrode A to elicit an action potential in the target cell. Confirm via recording on the same electrode.
- Probe for Crosstalk: On a neighboring electrode (Electrode B) at varying distances, record baseline activity while stimulating via Electrode A.
- Vary Distance: Repeat step 4 for multiple distances (using different electrode pairs) and stimulation amplitudes.
- Define Minimum Spacing: The minimum spacing is defined as the distance where no evoked activity is recorded on Electrode B at the maximum planned stimulation amplitude on A.
Title: Stimulation Isolation and Crosstalk Pathways
The Scientist's Toolkit
Table 2: Essential Research Reagent Solutions & Materials
| Item | Function in Protocol | Example/Specification |
|---|---|---|
| Conductivity Meter | Measures the conductivity (σ) of cell culture medium for resistivity calculation. | Benchtop meter with temperature probe, range 0.1 µS/cm to 200 mS/cm. |
| Cell Culture Medium | The electrolyte in which measurements are taken; its properties define ρ. | Phenol-red free DMEM, pre-warmed to 37°C. |
| Conductivity Standard Solution | For accurate calibration of the conductivity meter. | 1413 µS/cm KCl standard at 25°C. |
| Microelectrode Array (MEA) | Provides the substrate with embedded electrodes at defined spacing for experimentation. | 60-electrode array with 30 µm diameter, 200 µm spacing (or variable). |
| MEA Amplifier/Stimulator | Provides electrical interface for precise current injection and low-noise voltage recording. | System with 1+ stimulation units and 60+ recording channels. |
| Biphasic Current Stimulus | The applied signal for probing field penetration; biphasic avoids net charge build-up. | Programmable waveform: ±10 nA to ±10 µA, 0.1-2 ms phase. |
| Data Acquisition Software | Controls stimulation protocols, records potentials, and enables spatial analysis. | Custom or commercial software (e.g., MC_Rack, Axis). |
| Excitable Cells | Biological test system for functional validation of stimulation isolation. | iPSC-derived cardiomyocytes or primary neuronal cultures. |
This application note details the practical implementation of a core tenet of the overarching thesis: Protocol for minimizing electrode spacing in cell design research. The primary objective is to maximize the detection fidelity of weak, transient extracellular signals—such as those from cardiomyocytes, neurons, or electrogenic organoids—by systematically reducing the electrode-to-cell distance. This directly enhances the Signal-to-Noise Ratio (SNR), a critical parameter for discerning true biological events from system and environmental noise. The protocols herein are designed for researchers and drug development professionals requiring high-fidelity electrophysiological data.
Table 1: Impact of Electrode Spacing on Key Electrophysiological Parameters
| Electrode-Cell Spacing (µm) | Typical Measured Signal Amplitude (µV) | Estimated Baseline Noise (µV) | Calculated SNR (Signal/Noise) | Primary Noise Source |
|---|---|---|---|---|
| 100 | 10 - 50 | 5 - 10 | 1 - 10 | Environmental EMI, Johnson-Nyquist |
| 50 | 50 - 200 | 3 - 7 | 8 - 67 | Medium/Electrolyte Resistance |
| 10 (Planar MEAs) | 200 - 1000 | 2 - 5 | 40 - 500 | Electrode-Electrolyte Interface |
| <1 (Nanopillar/Nanogap) | 1000 - 5000 | 1 - 3 | 333 - 5000 | Intrinsic Device Thermal Noise |
Table 2: Comparison of Technologies for Minimizing Spacing
| Technology Platform | Achievable Spacing | Key Advantage | Primary Challenge |
|---|---|---|---|
| Planar Microelectrode Arrays (MEAs) | 10 - 50 µm | Standardized, high-throughput | Cell settling variability |
| 3D Micropillar/Nanopillar MEAs | 0 - 5 µm | Conformal contact, improved seal | Fabrication complexity, cell viability |
| Nanowire Field-Effect Transistors | < 100 nm | Intracellular-like sensitivity, sub-µm | Functionalization consistency |
| Microtube-based Electrodes | ~1 µm (wrapped) | High seal resistance, stable recording | Low-density arrays, insertion trauma |
Experimental Protocols
Protocol 3.1: Fabrication and Functionalization of Nanopillar MEA for Sub-Micron Spacing
Objective: To create a cell-culture substrate with vertically aligned conductive nanopillars that penetrate the cell cleft, effectively reducing the effective electrode-cell spacing to near-zero.
Materials: See "The Scientist's Toolkit" (Section 5).
Methodology:
- Substrate Patterning: Spin-coat a silicon wafer with a positive photoresist (e.g., AZ 5214). Use photolithography to define the array pattern for nanopillar bases.
- Dry Etching: Perform inductively coupled plasma reactive ion etching (ICP-RIE) using a Bosch process to etch silicon pillars to a target height of 2-3 µm and a diameter of 200-500 nm.
- Insulation Layer Deposition: Conformally deposit a 100 nm layer of silicon dioxide (SiO₂) via plasma-enhanced chemical vapor deposition (PECVD) over the entire array.
- Tip Exposure: Use a controlled argon ion milling step to selectively remove the SiO₂ insulation from the top ~1 µm of each nanopillar, exposing the conductive silicon core.
- Metallization & Functionalization: Sputter a 20 nm layer of Pt or Ti/Au onto the exposed tips. Sterilize the array in 70% ethanol for 30 minutes. Coat with 0.1 mg/mL poly-D-lysine or laminin in PBS for 2 hours at 37°C to promote cell adhesion.
- Cell Seeding: Seed primary cardiomyocytes or neurons at a high density (e.g., 1.5 x 10⁶ cells/cm²) in a defined culture medium onto the functionalized array.
Protocol 3.2: Electrophysiological Recording and SNR Calculation from High-Density MEA
Objective: To acquire extracellular action potentials (EAPs) and quantitatively compare SNR between conventional planar electrodes and reduced-spacing configurations.
Materials: Prepared MEA (planar vs. nanopillar), MEA amplifier system (e.g., Multi Channel Systems, Maxwell Biosystems), cell culture, environmental chamber (37°C, 5% CO₂), data acquisition software.
Methodology:
- System Setup: Place the cell-cultured MEA in the amplifier headstage within the environmental chamber. Allow the system to thermally equilibrate for 15 minutes.
- Noise Floor Acquisition: Record baseline electrical activity from all electrodes for 300 seconds in the absence of active cell culture (or from a cell-free area). Apply a bandpass filter of 100-3000 Hz in hardware/software.
- Signal Acquisition: Record spontaneous or stimulated cellular activity for a minimum of 10 minutes. Ensure stable environmental conditions to minimize drift.
- Data Processing (Per Electrode):
- Noise (N): Calculate the root-mean-square (RMS) voltage of the baseline recording from Step 2.
- Signal (S): For each identified EAP spike, calculate the peak-to-peak amplitude (Vpp). Use the average Vpp of at least 50 consecutive, well-isolated spikes.
- SNR Calculation: Compute as SNR (dB) = 20 * log₁₀( Average Vpp / RMS Noise ).
- Statistical Comparison: Perform an unpaired t-test on the SNR values (in dB) obtained from 20+ electrodes each on planar and nanopillar regions of the same array. A p-value < 0.01 indicates a statistically significant improvement.
Visualizations
Title: Causes of Poor Signal Fidelity from Large Spacing
Title: Workflow for Fabricating Reduced-Spacing Nanoelectrodes
The Scientist's Toolkit: Key Research Reagent Solutions
Table 3: Essential Materials for Reduced-Spacing Electrophysiology
| Item/Category | Specific Example(s) | Function & Relevance to SNR |
|---|---|---|
| Advanced MEA Substrates | 3D Nanopillar MEAs (MaxWell Biosystems), Nanowire FET arrays (Neuropixels 2.0) | Physically minimize spacing; provide nanostructured interfaces for tight seal and enhanced signal coupling. |
| Cell-Adhesion Promoters | Poly-D-lysine (PDL), Laminin, Synthemax II-S, Peptide (e.g., RGD) coatings | Ensure stable, close apposition of cell membrane to electrode surface, reducing variable cleft distances. |
| Low-Noise Amplification Systems | Intan RHS 32-channel, Multi Channel Systems (MCS) 60-channel headstage | Provide initial signal amplification with minimal added thermal and input-referred voltage noise. |
| Specialized Cell Culture Media | Electrophysiology-grade media (e.g., BrainPhys, Cardiomyocyte Maintenance Medium) | Optimized ionic composition for electrical activity; often serum-free to reduce insulating protein buildup on electrodes. |
| Conductive Interface Materials | PEDOT:PSS coatings, Porous Pt black, TiN nanostructuring | Increase effective electrode surface area, lowering impedance at the critical electrode-electrolyte interface, thus reducing thermal noise. |
| Environmental Shielding | Faraday cages, Vibration isolation tables, Temperature-controlled incubator enclosures | Mitigate dominant external noise sources (EMI, mechanical vibration, thermal drift) that become more apparent as spacing decreases and intrinsic signals strengthen. |
Application Notes
This document details modern electrophysiological and cell monitoring techniques, framed within the thesis goal of minimizing electrode spacing to enhance signal fidelity, spatial resolution, and data density in cell-based assays. Closely spaced microelectrodes enable higher-resolution mapping of cellular networks and more sensitive detection of localized electrophysiological events.
Patch-Clamp Alternatives (Planar Patch-Clamp)
High-throughput automated patch-clamp systems utilize planar electrode arrays. Minimizing spacing between recording sites on the chip is critical for parallel, independent recordings from multiple cells in a population.
Key Quantitative Data: Table 1: Comparison of Planar Patch-Clamp Systems
| System/Feature | Typical Aperture Diameter | Seal Resistance | Success Rate (Cell Line Dependent) | Approx. Max Concurrent Recordings |
|---|---|---|---|---|
| Traditional Patch-Clamp | 1-2 µm | >1 GΩ | 30-50% | 1-2 |
| Standard Planar Array | 1-2 µm | >100 MΩ | 20-60% | Up to 384 |
| High-Density Micro-Aperture Array | <1 µm | >500 MΩ | 40-70% | Up to 768 |
Extracellular Recording (Microelectrode Arrays - MEAs)
MEAs record field potentials and action potentials from electroactive cells (e.g., neurons, cardiomyocytes). Reducing inter-electrode spacing increases the spatial resolution of network activity mapping.
Key Quantitative Data: Table 2: MEA Performance vs. Electrode Spacing
| Electrode Spacing | Spatial Resolution | Typical Array Size | Key Advantage | Signal Cross-Talk Risk |
|---|---|---|---|---|
| 200-500 µm | Low | 8x8 to 12x12 | Well-established, low complexity | Low |
| 50-100 µm | Medium | 32x32 to 64x64 | Good for network bursting analysis | Moderate |
| 10-30 µm | High | 128x128 to 256x256 | Single-cell & sub-cellular resolution | High (requires shielding) |
Impedance-Based Cell Monitoring (Electric Cell-substrate Impedance Sensing - ECIS)
ECIS monitors cell behavior (adhesion, proliferation, barrier function) via impedance measured across microelectrodes. Smaller, closely spaced electrodes increase sensitivity to subtle localized changes.
Key Quantitative Data: Table 3: Impedance Sensitivity Factors
| Parameter | Standard ECIS Electrode (Ø 250 µm) | High-Density Microelectrode (Ø 50 µm) |
|---|---|---|
| Focal Adhesion Sensitivity | Moderate | High |
| Spatial Information | Bulk average | Multiplexed, localized |
| Optimal Measurement Frequency | 1-10 kHz | 1-50 kHz |
| Baseline Impedance (No Cells) | ~1-2 kΩ | ~10-20 kΩ |
Experimental Protocols
Protocol 1: High-Density MEA for Neuronal Network Analysis
Objective: Record high-resolution extracellular activity from a monolayer of iPSC-derived neurons. Materials: High-density MEA (HD-MEA) chip (e.g., 256 electrodes, 30 µm spacing), cell culture media, laminin coating solution, recording amplifier with multiplexer.
Methodology:
- Chip Preparation: Sterilize HD-MEA with 70% ethanol. Coat electrode area with poly-D-lysine/laminin (50 µg/mL) for 1 hour at 37°C.
- Cell Seeding: Dissociate neuronal culture and seed at high density (1500-2000 cells/mm²) onto the active area.
- Culture: Maintain cells on the MEA in an incubator (37°C, 5% CO₂) for 2-4 weeks to allow network maturation, with medium changes every 2-3 days.
- Recording Setup: Place MEA in amplifier stage. Maintain at 37°C with perfused carbogen (95% O₂, 5% CO₂). Use built-in multiplexing to sequentially record from all electrodes.
- Data Acquisition: Record extracellular signals at 20-50 kHz sampling rate per channel. Apply a bandpass filter (200-3000 Hz) for action potential detection.
- Analysis: Use spike sorting algorithms (e.g., Kilosort) to assign signals to individual neurons based on waveform and electrode proximity.
Protocol 2: Impedance-Based Barrier Integrity Assay on Microelectrodes
Objective: Monitor real-time endothelial barrier formation and disruption using a high-density impedance array. Materials: Multi-frequency impedance analyzer, 96-well plate with integrated 4x4 microelectrode arrays per well (50 µm diameter, 100 µm spacing), endothelial cell line (e.g., HUVECs), assay media, Histamine (challenge agent).
Methodology:
- Baseline Measurement: Add 200 µL of cell-free culture medium to each well. Measure impedance at 1, 10, and 25 kHz frequencies for all electrodes to establish baseline.
- Cell Seeding & Culture: Seed HUVECs at 50,000 cells/well. Culture for 48-72 hours until a confluent monolayer forms.
- Continuous Monitoring: Place plate in impedance analyzer inside a tissue culture incubator. Take automated impedance measurements every 10 minutes.
- Experimental Challenge: Once impedance stabilizes (indicating mature barrier), add Histamine (100 µM final concentration) to test wells.
- Data Processing: Calculate normalized impedance (Z) or cell index (CI = Zcell/Zbackground - 1). Plot CI over time. The rate and extent of CI drop post-challenge quantifies barrier disruption.
- Analysis: Use data from multiple, closely spaced electrodes to identify localized "leaky" regions within the monolayer.
Visualization
Diagram Title: Workflow: Electrode Miniaturization to High-Resolution Data
Diagram Title: Impedance Drop: Barrier Disruption Pathway
The Scientist's Toolkit
Table 4: Essential Research Reagent Solutions & Materials
| Item | Function & Relevance to Min. Spacing |
|---|---|
| High-Density MEA/Planar Patch Chip | Core substrate with microfabricated, closely spaced electrodes (10-50 µm). Enables high-resolution recording. |
| Extracellular Matrix (e.g., Laminin, Poly-D-Lysine) | Coats electrodes to promote specific cell adhesion and improve seal/contact resistance. |
| Cell Culture Media Optimized for Electrophysiology | Supports health and electroactivity of neurons/cardiomyocytes during long-term recordings. |
| Multiplexed Amplifier System | Electronically switches between dense electrode arrays for feasible data acquisition from hundreds of sites. |
| Spike Sorting Software (e.g., Kilosort, SpyKING CIRCUS) | Critical for deconvoluting overlapping signals from neighboring, closely spaced electrodes. |
| Multi-Frequency Impedance Analyzer | Measures impedance at various AC frequencies to dissect different cell behaviors (adhesion, barrier, morphology). |
| Electrode Insulation Polymer (e.g., SU-8, Parylene-C) | Electrically isolates microelectrodes to prevent crosstalk, a critical requirement as spacing decreases. |
| Perfusion System with Temperature/CO₂ Control | Maintains cell viability during extended recordings outside an incubator. |
The selection of electrode material is critical for bioelectronic interfaces, influencing signal-to-noise ratio, biocompatibility, and long-term stability. Within the context of minimizing electrode spacing for high-resolution cellular electrophysiology or stimulation, material properties dictate the feasible geometric limits and the quality of the biotic-abiotic interface.
Table 1: Key Properties of Common Electrode Materials
| Property | Gold (Au) | Platinum (Pt) | Indium Tin Oxide (ITO) |
|---|---|---|---|
| Conductivity (MS/m) | 45.2 | 9.43 | ~0.1-1 (film dependent) |
| Charge Injection Limit (mC/cm²) | 0.05-0.1 | 0.15-0.2 (Pt Black: 1-3) | 0.01-0.03 |
| Electrochemical Stability Window | Moderate (Oxidizes at >0.6V) | Excellent (Inert) | Good (Can corrode at low pH) |
| Optical Transparency | Opaque | Opaque | High (>80% transmittance) |
| Common Fabrication | Evaporation, Sputtering | Sputtering, Electroplating | Sputtering, Spray Pyrolysis |
| Typical Impedance (1 kHz, 50 µm Ø) | ~200 kΩ | ~150 kΩ (Pt Black: ~10 kΩ) | ~1-5 MΩ |
| Key Advantage | Ease of functionalization, stable baseline | High charge injection, durability | Optical transparency, compatible with microscopy |
| Key Disadvantage for Micro-spacing | Low charge injection limits miniaturization | Cost, opaque | Brittle, higher impedance |
Protocols for Electrode Preparation and Characterization
Protocol 2.1: Electrochemical Activation of Platinum Microelectrodes for Enhanced Charge Injection
Objective: To lower electrochemical impedance and increase the effective surface area of Pt microelectrodes, enabling safe operation at reduced spacing.
Materials & Reagents:
- Fabricated Pt electrode array (e.g., 10-50 µm diameter electrodes).
- Phosphate Buffered Saline (PBS), 0.1 M, sterile.
- Platinum electroplating solution: 3% Hexachloroplatinic acid (H₂PtCl₆) in Milli-Q water with 0.01% Lead(II) acetate.
- Potentiostat/Galvanostat with 3-electrode setup.
- Ag/AgCl reference electrode and Pt wire counter electrode.
Procedure:
- Cleaning: Clean the electrode array in isopropanol and Milli-Q water. Sterilize if required for subsequent cell culture (e.g., UV ozone treatment for 20 min).
- Electrochemical Setup: Immerse the array in 0.1 M PBS. Connect the working electrode(s) to the potentiostat. Place the reference (Ag/AgCl) and counter (Pt wire) electrodes.
- Cyclic Voltammetry (CV) Characterization: Perform CV from -0.6 V to +0.8 V vs. Ag/AgCl at 100 mV/s. Record the cathodic charge storage capacity (CSCc).
- Platinization (Pt Black Deposition): Transfer the array to the H₂PtCl₆ plating solution. Apply a constant cathodic current density of -10 mA/cm² (geometric area) for 30-60 seconds. Gentle bubbling is observed.
- Rinsing & Stabilization: Rinse thoroughly in sterile Milli-Q water. Return to PBS and run 20 cycles of CV (-0.6 V to +0.8 V, 100 mV/s) to stabilize the coating.
- Final Characterization: Record a final CV to calculate the new CSCc. Measure electrochemical impedance spectroscopy (EIS) from 1 Hz to 100 kHz at 10 mV RMS. A successful coating shows a significant drop in impedance (e.g., >80% at 1 kHz).
Protocol 2.2: Functionalization of Gold Microelectrodes with a Cell-Adhesive Peptide Monolayer
Objective: To create a stable, biomimetic interface on Au electrodes that promotes specific cell adhesion and reduces the foreign body response, crucial for stable recordings at minimized spacing.
Materials & Reagents:
- Fabricated Au electrode array.
- Ethanol (absolute, 200 proof).
- 1 mM solution of thiolated peptide (e.g., CRGDSP in sterile, deaerated PBS).
- Alkanethiol backfill solution (e.g., 1 mM 11-mercapto-1-undecanol in ethanol).
- Nitrogen gas stream.
Procedure:
- Electrode Cleaning: Sonicate electrodes in ethanol for 5 minutes. Dry under N₂. Perform UV ozone treatment for 15 minutes.
- Peptide Immobilization: Immediately immerse the array in the 1 mM thiolated peptide solution. Incubate for 2 hours at room temperature in a dark, humid chamber.
- Backfilling: Rinse gently with PBS to remove loosely bound peptides. Transfer to the alkanethiol backfill solution for 1 hour to passivate uncovered Au areas.
- Rinsing & Storage: Rinse sequentially with ethanol and sterile PBS. Store in sterile PBS at 4°C until use (within 24 hours). Avoid drying.
The Scientist's Toolkit: Research Reagent Solutions
Table 2: Essential Materials for Electrode-Cell Interface Research
| Item | Function & Relevance |
|---|---|
| Hexachloroplatinic Acid (H₂PtCl₆) | Source of Pt ions for electroplating Pt black, dramatically increasing surface area and charge injection capacity. |
| Lead(II) Acetate Additive | Catalyst in Pt plating bath, promoting the formation of a high-surface-area, dendritic Pt black layer. |
| Thiolated RGD Peptide (e.g., CRGDSP) | Forms a self-assembled monolayer (SAM) on Au, presenting a universal cell-adhesive motif to improve biocompatibility and cell-electrode coupling. |
| 11-Mercapto-1-undecanol | Hydrophilic alkanethiol used for backfilling Au surfaces, resisting non-specific protein adsorption and creating a well-defined mixed SAM. |
| Poly(3,4-ethylenedioxythiophene) Polystyrene Sulfonate (PEDOT:PSS) | Conductive polymer coating material (not primary here) for lowering impedance and improving neural interface fidelity. |
| Sterile Phosphate Buffered Saline (PBS) | Standard electrolyte for in vitro electrochemical testing and a biocompatible rinse solution. |
| Electroplating Setup (Potentiostat, 3-electrode cell) | Essential for precise control of electrochemical deposition and characterization of electrode properties. |
Signaling Pathways at the Bioelectronic Interface
Electrode materials interface with cells through both faradaic (charge transfer) and capacitive mechanisms, influencing cellular signaling pathways. The primary pathway for stimulation involves voltage-gated ion channel activation.
Title: Electrical Stimulation Pathway from Electrode to Cellular Response
For recording, the inverse process occurs, where ionic currents from cellular activity modulate the potential at the electrode interface.
Title: Extracellular Signal Recording Pathway from Cell to Electrode
Experimental Workflow for Minimized-Spacing Electrode Validation
This integrated protocol outlines steps from electrode preparation to functional validation with cells, critical for assessing performance at reduced scales.
Title: Integrated Workflow for Micro-Spacing Electrode Evaluation
Step-by-Step Protocol: Fabrication, Functionalization, and Cell Seeding for Minimal-Spacing Electrode Arrays
Achieving subcellular electrode spacing (<5 µm) is critical for high-resolution electrophysiological mapping, enabling the study of signal propagation in neurites, synaptic connectivity, and localized cellular responses to pharmaceuticals. This protocol details photolithography and microfabrication strategies to fabricate microelectrode arrays (MEAs) with electrode features and pitches at the scale of subcellular structures. The methodologies are framed within the broader thesis goal of minimizing electrode spacing to enhance signal localization and reduce cross-talk in in vitro cell-based assays for fundamental research and drug development.
Core Photolithography Strategies for Sub-5 µm Features
High-resolution photolithography is the limiting factor for defining subcellular electrode features. The following table summarizes key parameters and performance data for advanced lithography methods suitable for this application.
Table 1: Comparison of Photolithography Strategies for Subcellular Electrode Fabrication
| Lithography Method | Practical Resolution (µm) | Typical Electrode Pitch Achievable (µm) | Key Advantage | Primary Limitation | Compatible Substrate |
|---|---|---|---|---|---|
| UV Projection Stepper (i-line, 365 nm) | ~0.8 - 1.2 | 2 - 5 | High throughput, good alignment accuracy | Resolution limited by wavelength. Requires expensive mask. | Silicon, glass, flexible polymers |
| Deep UV (KrF, 248 nm) | ~0.25 - 0.5 | 1 - 2 | Higher resolution than i-line | Significant cost increase, photoresist complexity. | Silicon, glass |
| Laser Direct Write (LDW) | ~1.0 - 2.0 | 2 - 4 | Maskless, rapid prototyping | Lower throughput, slower write times for large arrays. | All planar substrates |
| Electron-Beam Lithography (EBL) | < 0.05 | < 1 | Ultimate resolution, maskless | Very low throughput, high cost, conductive substrates often needed. | Silicon, glass with conductive layer |
| Nanoimprint Lithography (NIL) | < 0.05 | < 1 | High resolution, high throughput post-master | Master template fabrication (often via EBL), defect management. | Thermoplastics, UV-curable resins on carriers |
Application Note: For most biological labs collaborating with cleanroom facilities, i-line projection lithography offers the best balance of resolution (~1 µm), cost, and throughput for fabricating MEAs with 3-5 µm electrode pitches. EBL is reserved for pioneering work requiring sub-micron features or irregular electrode geometries tailored to specific organelles.
Detailed Protocol: Fabrication of a MEA with 3 µm Electrode Pitch
Materials & Reagent Solutions
The Scientist's Toolkit: Essential Materials for MEA Fabrication
| Item | Function/Brief Explanation |
|---|---|
| 4-inch Borosilicate Glass Wafer | Primary substrate; optically transparent, biologically inert, and compatible with standard cleanroom processes. |
| Positive Photoresist (e.g., AZ 1512) | Light-sensitive polymer. Exposed areas become soluble in developer, defining the electrode pattern. |
| Hexamethyldisilazane (HMDS) | Adhesion promoter; ensures photoresist bonds strongly to the substrate. |
| Metal Targets (Ti, Pt, Au) | Source for sputtering. Titanium (Ti) is an adhesion layer. Platinum (Pt) or Gold (Au) are the conductive, biocompatible electrode materials. |
| Developer Solution (e.g., AZ 726 MIF) | Aqueous alkaline solution that dissolves exposed photoresist. |
| Acetone & Isopropanol (IPA) | Solvents for photoresist stripping and wafer cleaning. |
| SU-8 2002 Negative Photoresist | Biocompatible epoxy used to define the final insulation layer, leaving only electrode sites exposed. |
| Oxygen Plasma System | For critical surface cleaning and descumming (removing resist residues) before metal deposition. |
| Spin Coater | For applying uniform layers of photoresist and insulation. |
| Mask Aligner (i-line, 365 nm) | Aligns the photomask with the substrate and exposes the photoresist to UV light. |
| DC Magnetron Sputtering System | Deposits thin, uniform, and adherent metal films (Ti/Pt) onto the patterned substrate. |
| Lift-Off Remover (e.g., N-Methyl-2-pyrrolidone (NMP)) | Dissolves the underlying photoresist to remove excess metal, leaving only the desired electrode pattern ("lift-off" process). |
Step-by-Step Protocol
Protocol: Lift-Off Based Microfabrication of Pt Electrode Arrays
Day 1: Substrate Preparation and Patterning (Electrode Layer)
- Wafer Cleaning: Sonicate glass wafer in acetone for 5 minutes, followed by IPA for 5 minutes. Dry with nitrogen gas. Dehydrate on a 150°C hotplate for 10 minutes.
- Adhesion Promotion: Vapor-prime the wafer with HMDS in a vacuum oven for 30 minutes at 150°C.
- Photoresist Application: Spin-coat AZ 1512 photoresist at 4000 rpm for 45 seconds to achieve a ~1.2 µm thick film. Soft-bake on a hotplate at 110°C for 60 seconds.
- Exposure: Using an i-line (365 nm) mask aligner, expose the wafer through a dark-field photomask containing the array of electrode disc patterns (e.g., 3 µm diameter discs on a 3 µm pitch). Use a hard contact mode and an exposure dose of 120 mJ/cm².
- Development: Immerse the wafer in AZ 726 MIF developer for 60 seconds with gentle agitation. Rinse thoroughly in deionized water for 60 seconds and dry with N₂. Inspect under a microscope for clean disc-shaped openings in the resist.
- Descum: Place wafer in an oxygen plasma asher for 30 seconds at 100W to remove any organic residues from the exposed glass areas.
Day 2: Metal Deposition and Lift-Off
- Metal Deposition: Load wafer into a sputtering system. Deposit a 10 nm adhesion layer of Titanium (Ti), followed immediately by a 100 nm conductive layer of Platinum (Pt). Maintain a low pressure (<5 mTorr) and use DC power.
- Lift-Off: Submerge the wafer in a bath of NMP heated to 80°C for 60-90 minutes, with occasional gentle agitation. The photoresist dissolves, "lifting off" the metal deposited on top of it, leaving behind only the metal discs (electrodes) that were in direct contact with the glass.
- Cleaning: Rinse sequentially in fresh NMP, acetone, and IPA. Dry with N₂. Verify lift-off success and electrode integrity via microscopy.
Day 3: Insulation Layer Patterning
- Insulation Application: Spin-coat SU-8 2002 at 3000 rpm for 30 seconds to achieve a ~2 µm insulating layer. Soft-bake: 65°C for 1 min, then 95°C for 2 min.
- Insulation Patterning: Expose the SU-8 through a second photomask designed to open windows only over the center of each Pt electrode disc (e.g., 2 µm windows). Use an i-line dose of 100 mJ/cm². Post-exposure bake: 65°C for 1 min, then 95°C for 2 min.
- Insulation Development: Develop in SU-8 developer for 1 minute to dissolve unexposed areas, rinse in IPA, and dry. This exposes only the active electrode site while insulating all interconnects.
- Final Hard Bake: Cure the SU-8 insulation layer on a hotplate at 150°C for 10 minutes to enhance its chemical and mechanical stability for cell culture.
Day 4: Quality Control and Preparation for Cell Culture
- Electrical Test: Use a probe station to measure impedance and yield across the array. Target impedance for a 3 µm Pt disc in electrolyte is typically 1-5 MΩ at 1 kHz.
- Sterilization: Before cell culture, sterilize the MEA by soaking in 70% ethanol for 20 minutes, followed by multiple rinses in sterile phosphate-buffered saline (PBS) and exposure to UV light in a biosafety cabinet.
Visualization of Workflows and Considerations
Diagram 1: Lift-Off MEA Fabrication Workflow
Diagram 2: Trade-Offs in Minimizing Electrode Spacing
Substrate Preparation and Cleaning Protocols for Optimal Adhesion and Conductivity
Within the thesis "Protocol for minimizing electrode spacing in cell design research," achieving consistent, nanometer-scale electrode spacing is paramount. This goal is critically dependent on flawless substrate preparation. Contaminants as thin as a monolayer can drastically increase interfacial resistance, cause uneven electrodeposition, and promote delamination, effectively negating the benefits of reduced physical distance. These application notes provide detailed, actionable protocols for cleaning and preparing substrates to ensure optimal adhesion and electrical conductivity, directly supporting the fabrication of high-fidelity, closely spaced electrode arrays.
Key Contaminants and Their Impact on Microelectrode Performance
The efficacy of microelectrodes, especially at reduced spacing, is severely compromised by surface contaminants. The table below quantifies the impact of common contaminants on interfacial properties.
Table 1: Impact of Common Substrate Contaminants on Electrode Performance
| Contaminant Type | Typical Source | Effect on Adhesion | Effect on Conductivity/Resistance | Impact on Electrode Spacing Fidelity |
|---|---|---|---|---|
| Hydrocarbon Layer | Airborne organics, fingerprint oils | Reduces bond strength by >80% | Increases contact resistance by 10-1000x | Causes uneven lithography, bridging defects |
| Metallic Particles | Polishing, handling | Creates micro-shorts, local doping | Unpredictable leakage currents | Catastrophic short-circuiting between electrodes |
| Ionic Salts (K+, Na+, Cl-) | Sweat, cleaning residues | Promotes electrochemical corrosion | Alters interfacial impedance, especially in solution | Drifts in sensor baseline, increased noise |
| Oxide Layer (non-native) | Improper storage, oxidation of metal films | Poor adhesion of subsequent layers | Significantly increases sheet resistance | Leads to non-uniform etching and patterning |
| Water Monolayer | Ambient humidity, incomplete drying | Weakens epoxy/glue interfaces | Can hydrolyze and degrade conductive polymers | Contributes to parasitic capacitance |
Detailed Substrate Preparation Protocols
Protocol 3.1: RCA Standard Clean (for Silicon, Glass, SiO₂/Si Wafers)
This two-step cleaning process effectively removes organic, ionic, and metallic contaminants.
Reagents Required:
- RCA-1 (SC-1): 5:1:1 ratio of H₂O : NH₄OH (27-30%) : H₂O₂ (30%). Function: Removes organic contaminants and some metals via oxidative breakdown and complexation.
- RCA-2 (SC-2): 6:1:1 ratio of H₂O : HCl (37%) : H₂O₂ (30%). Function: Removes alkali and transition metal ions by forming soluble chlorides.
Procedure:
- Initial Rinse: Hold substrate with PTFE tweezers. Rinse copiously with deionized (DI) water (18.2 MΩ·cm).
- RCA-1 Bath:
- Prepare the SC-1 solution in a clean quartz or PTFE beaker. Caution: Exothermic reaction.
- Heat solution to 75 ± 5°C on a hotplate.
- Immerse substrates for 10 minutes with gentle agitation.
- Transfer immediately to a DI water overflow bath for 2 minutes.
- RCA-2 Bath:
- Prepare the SC-2 solution in a clean beaker.
- Heat solution to 75 ± 5°C.
- Immerse substrates for 10 minutes.
- Transfer to a DI water overflow bath for 2 minutes.
- Final Rinse & Dry:
- Perform a final 3-minute rinse in a steady stream of DI water.
- Dry substrates using a critical point dryer (preferred) or spin-rinse-dryer. Nitrogen blow-off is acceptable for non-critical layers; avoid compressed air.
Protocol 3.2: Piranha Etch for Radical Organic Removal (Glass, ITO, Gold)
Warning: Piranha solution is extremely aggressive, exothermic, and can detonate upon contact with organic solvents. Use only in a dedicated fume hood with appropriate personal protective equipment (PPE) and do not store.
Reagent: 3:1 ratio of concentrated H₂SO₄ (96%) : H₂O₂ (30%).
Procedure:
- In a clean, chemical-resistant beaker (labeled "PIRANHA"), slowly add the H₂O₂ to the H₂SO₄. Never reverse the order.
- Allow the solution to stabilize for 5 minutes. Submerge substrates using ceramic or PTFE tweezers.
- Soak for 10-15 minutes. The solution will vigorously bubble as organics are oxidized.
- Carefully remove substrates and immerse in a cold DI water bath.
- Rinse thoroughly with DI water for 5 minutes in an overflow bath.
- Dry with nitrogen or in an oven at 120°C for 10 minutes.
Protocol 3.3: Oxygen Plasma Treatment for Surface Activation
Plasma treatment cleans at the atomic level and functionalizes surfaces, increasing hydrophilicity and adhesion energy.
Typical Parameters:
- Power: 100 - 300 W (RF)
- Pressure: 0.2 - 0.5 Torr
- O₂ Flow Rate: 50 - 100 sccm
- Time: 30 seconds to 5 minutes
Procedure:
- Place substrates in the center of the plasma chamber.
- Evacuate chamber to base pressure (<50 mTorr).
- Introduce oxygen gas to the target pressure.
- Ignite plasma and treat for the predetermined time.
- Vent chamber and use substrates immediately (<15 minutes) for best results, as surface energy decays over time.
Verification and Quality Control Metrics
Post-cleaning verification is essential for protocol validation.
Table 2: Quantitative Metrics for Substrate Cleanliness Verification
| Metric | Method/Tool | Target Value for Optimal Adhesion/Conductivity | Significance for Minimal Spacing |
|---|---|---|---|
| Water Contact Angle | Goniometer | < 10° for hydrophilic bonding | Ensures uniform spin-coating of photoresist and even electroplating bath wetting. |
| Atomic Force Microscopy (AFM) Roughness (Ra) | Atomic Force Microscope | < 0.5 nm RMS over 5µm² | Prevents localized field concentration and breakdown between closely spaced electrodes. |
| X-ray Photoelectron Spectroscopy (XPS) C1s Signal | XPS | Atomic % Carbon < 10% | Verifies removal of organic barrier layers that increase contact resistance. |
| Sheet Resistance Uniformity | 4-Point Probe | Variation < ±2% across substrate | Critical for predictable current distribution in electrode arrays. |
| Particle Count (>0.3µm) | Surface particle scanner | < 10 particles/cm² | Eliminates particulate-induced shorts or lithographic defects. |
The Scientist's Toolkit: Research Reagent Solutions
Table 3: Essential Materials for Substrate Preparation Protocols
| Item | Function & Rationale |
|---|---|
| High-Purity Deionized Water (18.2 MΩ·cm) | Final rinsing agent to remove ionic residues without re-contamination. |
| Electronic Grade Acetone & Isopropanol (IPA) | Solvents for gross organic removal prior to RCA or Piranha cleans. Low metallic ion specification is crucial. |
| PTFE or PFA Tweezers & Beakers | Prevent leaching of ionic contaminants from the tools themselves during cleaning. |
| Hydrogen Peroxide (30%, Semiconductor Grade) | Oxidizing agent in RCA and Piranha cleans. Must be fresh (<24 hours opened) for optimal reactivity. |
| Ammonium Hydroxide & Hydrochloric Acid (Semiconductor Grade) | Complexing and solubilizing agents for metallic and ionic contaminants in RCA clean. |
| Sulfuric Acid (96%, Semiconductor Grade) | Primary component of Piranha etch; provides strong acidity and dehydration. |
| Oxygen Plasma System | Provides ultimate surface cleaning and activation via reactive oxygen radical species. |
| Critical Point Dryer (CPD) | Prevents pattern collapse and water-mark formation during drying of high-aspect-ratio microstructures. |
Visualization of Experimental Workflows
Diagram Title: RCA and Piranha Substrate Cleaning Workflow
Diagram Title: Relationship Between Cleanliness & Electrode Spacing Fidelity
1. Application Notes
Surface functionalization with defined coatings is a critical enabling technology for patterning cells with high spatial resolution. This is directly relevant to the thesis goal of minimizing electrode spacing in cellular electrophysiology and biosensor arrays, as it allows for the deterministic placement of individual cells or monolayers over microscopic electrodes. By controlling the adhesive properties of the substrate at the micrometer scale, signal crosstalk is reduced and signal-to-noise ratios are improved. Key coatings include synthetic polymers like Polyethylenimine (PEI), amino acids like L-ornithine, and natural Extracellular Matrix (ECM) proteins such as fibronectin, laminin, and collagen.
PEI, a cationic polymer, promotes strong, non-specific adhesion for a wide range of cell types, including neurons, facilitating rapid attachment. L-ornithine, a positively charged amino acid, is a milder alternative that enhances the adhesion of specific cell types like hepatocytes and certain neurons. ECM proteins provide specific integrin-mediated binding, promoting not only adhesion but also superior cell viability, differentiation, and mature function, which is crucial for generating physiologically relevant data in drug screening.
The choice of coating directly impacts the experimental outcome. For high-density microelectrode arrays (HD-MEAs) with pitch below 30 µm, precise micropatterning of these coatings is required to confine cell growth to the electrode area, isolating electrical signals from adjacent recording sites.
Table 1: Comparison of Common Functionalization Coatings for Cell Positioning
| Coating Type | Example(s) | Primary Mechanism | Key Advantages | Limitations | Optimal Use Case |
|---|---|---|---|---|---|
| Cationic Polymer | Polyethylenimine (PEI), Poly-L-Lysine (PLL) | Electrostatic interaction with negatively charged cell membrane | Strong, rapid adhesion; cost-effective; simple protocol | Non-specific; can be cytotoxic at high concentrations; may promote glial overgrowth | Initial neuronal plating for acute studies; non-specific adhesive substrate |
| Amino Acid | L-ornithine | Electrostatic & potential receptor-mediated interaction | Milder than PEI/PLL; supports specific cell types (hepatocytes) | Weaker adhesion for some cell types; limited to specific applications | Primary hepatocyte culture; specialized neural cultures |
| ECM Proteins | Fibronectin, Laminin, Collagen I/IV | Specific integrin binding | Bioactive; promotes survival, differentiation, & function; cell-type specific | More complex preparation; batch variability; higher cost | Long-term functional studies; differentiated cell models (e.g., cardiomyocytes, polarized epithelia) |
| Patterned Coatings | Microcontact-printed ECM | Spatial restriction of adhesive areas | Enables single-cell positioning; defines network geometry; prevents overgrowth | Requires microfabrication equipment (PDMS stamps, photomasks) | HD-MEA cell isolation; defined neuronal networks; organ-on-chip structures |
2. Detailed Protocols
Protocol 2.1: Standard Substrate Coating for Global Adhesion Objective: To uniformly functionalize a glass or MEA substrate to promote cell adhesion over the entire surface. Materials: Sterile PBS, coating solution (e.g., 0.1 mg/mL PEI in borate buffer, 20 µg/mL Laminin in PBS, or 0.01% Poly-L-Ornithine), cultureware.
- Clean substrate (e.g., coverslip or MEA) with 70% ethanol, air dry under UV in laminar flow hood for 30 min.
- Apply sufficient coating solution to cover the surface (e.g., 50 µL/cm²).
- Incubate: 1 hour at room temp for PEI/PLL; 2 hours at 37°C or overnight at 4°C for ECM proteins.
- Aspirate solution and rinse 3x with sterile PBS or cell culture-grade water.
- Air dry completely in the hood. Substrates can be used immediately or stored sealed at 4°C for up to 1 week.
Protocol 2.2: Micropatterning via Microcontact Printing for Single-Cell Positioning Objective: To create micron-scale adhesive islands of ECM protein to guide attachment of individual cells directly over microelectrodes. Materials: PDMS stamp (fabricated from an SU-8 master with features matching electrode layout), fibronectin solution (50 µg/mL in PBS), Pluronic F-127 (0.2% w/v in PBS), sterile Petri dish.
- Ink the Stamp: Apply fibronectin solution to the patterned face of the PDMS stamp for 1 hour in a humid chamber.
- Dry the Stamp: Blow dry gently with filtered air or nitrogen.
- Stamp the Substrate: Carefully place the inked stamp onto the pre-cleaned MEA/chip substrate. Apply gentle, even pressure for 30 seconds. Remove stamp. Adhesive protein islands are now transferred.
- Block Non-Patterned Areas: Immediately flood the substrate with Pluronic F-127 solution. Incubate for 30-60 min to passivate areas without protein.
- Rinse: Aspirate Pluronic and rinse 3x with sterile PBS. The substrate is now ready for cell seeding.
Protocol 2.3: Seeding Cells on Patterned Substrates
- Prepare a single-cell suspension at an optimized density (e.g., 1,000–5,000 cells/cm² for single-cell patterning).
- Seed cells dropwise onto the patterned substrate.
- Allow cells to settle and attach for 15-30 min in the incubator (37°C, 5% CO₂).
- Gently add pre-warmed complete culture medium without disturbing the settled cells.
- Monitor attachment after 2-4 hours. Non-adhered cells on Pluronic-blocked areas can be gently washed away with a medium change after 24 hours.
3. Visualizations
Title: Functionalization Strategy for High-Density MEAs
Title: Microcontact Printing Workflow for Cell Patterning
4. The Scientist's Toolkit: Essential Research Reagents & Materials
Table 2: Key Reagents for Surface Functionalization and Patterning
| Item | Function/Benefit | Typical Specification/Note |
|---|---|---|
| Polyethylenimine (PEI) | Cationic polymer for strong, non-specific cell attachment. | 0.1% (w/v) in borate buffer (pH 8.4). Use branched, ~25kDa for neurons. |
| Poly-L-Ornithine (PLO) | Poly-amino acid coating, milder than PEI. | 0.01-0.1 mg/mL in PBS or borate buffer. |
| Laminin | Key ECM protein for neuronal differentiation, synapse formation. | Mouse natural, 1-20 µg/mL in PBS. Avoid repeated freeze-thaw. |
| Fibronectin | Versatile ECM protein promoting adhesion of many cell types via α5β1 integrin. | Human plasma, 5-50 µg/mL in PBS. |
| Collagen I | Major structural ECM protein, ideal for epithelial, fibroblast, cardiac cells. | Rat tail, 50-100 µg/mL in 0.02M acetic acid. |
| Pluronic F-127 | Non-ionic surfactant for blocking non-adhesive areas; prevents non-specific binding. | 0.1-0.2% (w/v) in PBS or water. Critical for patterning. |
| PDMS (Sylgard 184) | Silicone elastomer for creating microcontact printing stamps. | 10:1 base:curing agent ratio. Cured on SU-8 silicon master. |
| SU-8 Photoresist | Negative photoresist for fabricating high-resolution masters for PDMS stamps. | Thickness defines stamp feature height (e.g., 2-5 µm). |
Within the context of advancing protocols to minimize electrode spacing in cell-based biosensors and electrophysiological research, precise single-cell registration is paramount. Reducing inter-electrode distances to the cellular scale (≤ 100 µm) necessitates exact placement of individual cells onto predefined electrode arrays. This application note details three core techniques—Low-Density Plating, Microfluidic Guidance, and Optical Tweezing—to achieve high-confidence single-cell registration, thereby enabling high-resolution, parallel single-cell analysis.
Research Reagent Solutions Toolkit
| Item | Function & Relevance to Single-Cell Registration |
|---|---|
| Poly-D-Lysine/Laminin | Coats substrate to promote cell adhesion at defined locations, critical for low-density plating stability. |
| CellTracker Dyes (e.g., CMFDA) | Fluorescent cytoplasmic labels for post-seeding verification of single-cell registration and viability. |
| PDMS (Polydimethylsiloxane) | Elastomer for fabricating microfluidic channels that guide cells via hydrodynamic forces. |
| Opti-MEM Reduced Serum Medium | Low-protein, low-viscosity medium ideal for optical tweezing to minimize laser scattering and heating. |
| Anti-Adhesion Surfactant (e.g., Pluronic F-127) | Passivates microchannels to prevent non-specific cell sticking, ensuring guided movement. |
| Matrigel (Basement Membrane Matrix) | Provides a physiological 3D matrix for seeding cells in more biomimetic microfluidic environments. |
| IR-1064 Laser Dye | For calibrating optical trap wavelength (typically 1064 nm) to ensure minimal cellular photodamage. |
Quantitative Technique Comparison
Table 1: Comparative Analysis of Single-Cell Seeding Techniques
| Parameter | Low-Density Plating | Microfluidic Guidance | Optical Tweezing |
|---|---|---|---|
| Typical Throughput (cells/hr) | 10² - 10³ (statistical) | 10³ - 10⁴ | 1 - 10² |
| Positional Accuracy (µm) | ±100 - 1000 | ±10 - 50 | ±0.1 - 1 |
| Single-Cell Registration Confidence | Low (random) | Medium-High | Very High |
| Cell Viability Post-Seeding | >90% | >85% | 70-95%* |
| Typical Equipment Cost | Low | Medium | Very High |
| Compatibility with Dense Microelectrode Arrays | Poor | Good | Excellent |
| Suitable for Suspension Cells | No | Yes | Yes |
*Viability highly dependent on laser parameters and cell type.
Detailed Experimental Protocols
Protocol 1: Low-Density Plating for Sparse Single-Cell Isolation
Aim: To statistically achieve isolated single cells on a substrate via dilution.
- Materials: Culture medium, trypsin/EDTA, hemocytometer, poly-D-lysine coated dish or MEA chip, sterile PBS.
- Procedure:
- Harvest adherent cells using standard trypsinization. Neutralize with medium and centrifuge.
- Resuspend pellet in fresh medium and perform a cell count using a hemocytometer or automated counter.
- Critical Calculation: Dilute cell suspension to a final density of 500 - 5,000 cells/mL. For a standard 35 mm dish (∼8 cm² growth area), this yields approximately 50 - 500 cells/dish.
- Seed the calculated volume of diluted suspension onto the pre-coated target substrate.
- Gently rock the dish to ensure even distribution and place in a 37°C, 5% CO₂ incubator for 2-4 hours to allow for initial adhesion.
- Under a microscope, map locations of isolated single cells relative to electrode coordinates.
Protocol 2: Hydrodynamic Microfluidic Guidance for Directed Seeding
Aim: To actively direct cells into microwells or over microelectrodes using fluid flow.
- Materials: Fabricated PDMS microfluidic device, syringe pump, tubing, cell suspension (1-5 x 10⁵ cells/mL in low-viscosity medium).
- Procedure:
- Sterilize the PDMS microfluidic chip by UV exposure for 30 minutes.
- Pre-wet all channels with sterile, particle-free PBS or serum-free medium.
- Load the cell suspension into a 1 mL syringe and mount it onto a precision syringe pump.
- Connect the syringe to the chip's inlet port via tubing.
- Critical Flow Parameters: Set the pump to a constant flow rate between 1 - 10 µL/min. This generates laminar flow, guiding cells into physical traps or over electrode sites without excessive shear stress.
- Monitor the seeding process in real-time using an inverted microscope until target microwells are occupied.
- Stop the pump, carefully disconnect the tubing, and transfer the chip to the incubator for culture.
Protocol 3: Optical Tweezing for High-Precision Single-Cell Registration
Aim: To use a focused laser beam to "trap" and manipulate a single cell onto a specific microelectrode.
- Materials: Integrated optical tweezer-microscope system, IR-optimized culture chamber, low-absorption medium (e.g., Opti-MEM), cell suspension.
- Procedure:
- Calibrate the optical trap using 1-10 µm polystyrene beads to determine trap stiffness and precise laser alignment.
- Place the target substrate (e.g., MEA with 30 µm spacing) in the observation chamber.
- Introduce a dilute cell suspension into the chamber. Allow cells to settle near the substrate plane.
- Using a low-magnification objective (10x), identify a target cell and the destination electrode.
- Switch to a high-NA (≥1.2) water-immersion objective. Bring the laser trap to focus near the target cell.
- Gently capture the cell by positioning the laser focus at its center. A visible "snap" into the trap indicates capture.
- Critical Manipulation: Move the microscope stage or steer the laser beam with nanometer precision to translate the trapped cell directly onto the center of the target electrode.
- Release the cell by turning off the laser trap. Verify registration via brightfield and fluorescence imaging.
Visualizations
Low-Density Plating Workflow
Microfluidic Cell Guidance Process
Optical Tweezing for Single-Cell Registration
Culture and Maintenance Under Electrical Monitoring Conditions
The imperative to minimize electrode spacing in cell-based biosensors and electrophysiological platforms is a cornerstone of modern cell design research. Reduced spacing enhances signal-to-noise ratio, increases spatial resolution for network analysis, and improves the sensitivity of extracellular recordings. This pursuit, however, introduces significant challenges for the concomitant culture and maintenance of cells under electrical monitoring conditions. Prolonged on-electrode viability, functional phenotype stability, and mitigation of electrochemical byproducts become critical. These Application Notes provide detailed protocols to sustain healthy, functional cellular models within the constraints of close-electrode microenvironments, directly supporting the overarching thesis of advancing high-density, high-fidelity cell-electrode interfaces.
Table 1: Impact of Electrode Spacing on Culture Parameters & Signal Quality
| Parameter | Electrode Spacing >100µm | Electrode Spacing 20-50µm (Target) | Electrode Spacing <10µm | Key Implication for Culture |
|---|---|---|---|---|
| Typical Cell Density | 500-1000 cells/mm² | 1000-3000 cells/mm² | >5000 cells/mm² (constrained) | Nutrient depletion & waste accumulation accelerate. Requires optimized media perfusion. |
| Approx. Signal Amplitude (Extracellular) | 50-200 µV | 100-500 µV | Can exceed 1 mV (theoretical) | Higher metabolic demand to support electrical activity; culture health is paramount. |
| Electrochemical Interface Stress | Low | Moderate | High | Increased risk of toxic byproduct (e.g., H₂O₂, metal ions) generation. Requires coatings/ protocols to shield cells. |
| Common Substrate Coating | Poly-L-lysine, laminin | PEI, laminin-521, synthetic peptide grids | Nano-porous gels, conductive polymers (e.g., PEDOT:PSS) | Coatings must ensure adhesion in confined spaces while maintaining low impedance. |
| Recommended Media Change Frequency (Static) | Every 2-3 days | Every 1-2 days | Daily or continuous perfusion | Frequency scales inversely with spacing to maintain homeostasis. |
Table 2: Key Reagent Solutions for Maintenance Under Electrical Monitoring
| Reagent / Material | Primary Function | Critical Consideration for Close Spacing |
|---|---|---|
| Neurobasal-A/B-27 Plus Supplement | Serum-free support for primary neurons; minimizes glial overgrowth. | Essential for clear, neuron-only networks on dense electrode arrays. Prevents signal crosstalk from over-proliferation. |
| Cytosine β-D-arabinofuranoside (Ara-C) | Mitotic inhibitor to control glial proliferation. | Timed application (DIV 3-5) is crucial to maintain monolayer integrity without disturbing nascent networks on electrodes. |
| Polyethylenimine (PEI) / Laminin Coating | Promotes ultra-strong neuronal adhesion. | Prevents detachment during medium changes in high-density, high-fluid-shear environments on chips. |
| PEDOT:PSS Electrode Coating | Conductive polymer coating lowers impedance, increases charge injection limit. | Provides a more biocompatible interface, reducing Faradaic reactions and toxic byproducts near cells. |
| Artificial Cerebrospinal Fluid (aCSF) for Recording | Ionic buffer for electrophysiology. Must be HEPES-buffered for ambient CO₂. | Perfusion must be precisely controlled (0.5-2 mL/min) to prevent shear stress on tightly packed cells. |
| CellTracker or Calcein-AM Viability Dyes | Fluorescent live-cell staining for concurrent viability assessment. | Enables correlative analysis of electrical activity and cell health without fixing, critical for longitudinal studies. |
| Trolox (Vitamin E analog) | Antioxidant to mitigate reactive oxygen species (ROS). | Counteracts ROS generated at electrode surfaces, especially during high-frequency stimulation protocols. |
Core Experimental Protocols
Protocol 3.1: Coating & Plating for High-Density Microelectrode Arrays (MEAs)
Aim: To prepare a substrate that ensures robust cell adhesion and biocompatibility on closely spaced electrodes. Materials: Sterile MEA chip, 0.1% Polyethylenimine (PEI) in Borate Buffer (pH 8.4), Laminin (1 µg/mL in PBS), sterile Dulbecco’s Phosphate-Buffered Saline (DPBS).
- MEA Sterilization: Place the MEA in a sterile culture hood. UV sterilize the active surface for 30 minutes.
- PEI Coating: Apply enough 0.1% PEI solution to completely cover the electrode array area. Incubate for 1 hour at 37°C.
- Washing: Aspirate PEI. Rinse the surface three times with sterile DPBS, ensuring no salt precipitation.
- Laminin Coating: Apply laminin solution (1 µg/mL). Incubate for a minimum of 2 hours at 37°C.
- Final Prep: Immediately before plating, aspirate laminin. Do not let the surface dry. Rinse once with plain plating medium.
Protocol 3.2: Perfusion Maintenance System for Long-Term Electrical Recording
Aim: To maintain physiological conditions and minimize environmental fluctuations during continuous electrical monitoring. Materials: Peristaltic pump, gas-permeable silicone tubing, media reservoir, heated incubator enclosure, custom MEA lid with inlet/outlet ports, recirculating or fresh medium.
- System Assembly: Connect reservoir → pump → inlet port → MEA chamber → outlet port → waste/recirculation line using gas-permeable tubing.
- Flow Rate Calibration: Calibrate pump to a flow rate of 0.5-1.0 mL/hour for a ~2 mL chamber. Critical: This ensures medium exchange without generating shear forces sufficient to detach cells.
- Gas & Temperature Control: Place the entire assembly in a temperature-controlled enclosure (37°C) with 5% CO₂ if using bicarbonate buffer, or use HEPES-buffered aCSF in ambient air.
- Initiation & Monitoring: Start perfusion 1 hour after cell plating. Monitor reservoir levels daily and check for tubing bubbles, which disrupt electrical recordings.
Protocol 3.3: Viability Assay Concurrent with Electrical Recording
Aim: To assess cell health in situ without terminating a long-term electrical recording experiment. Materials: Calcein-AM (1 mM stock in DMSO), Ethidium Homodimer-1 (EthD-1, 2 mM stock), pre-warmed recording buffer.
- Dye Preparation: Combine Calcein-AM and EthD-1 in pre-warmed recording buffer to final concentrations of 2 µM and 4 µM, respectively. Protect from light.
- Assay Execution: Pause electrical recording. Gently replace the medium in the MEA chamber with the dye solution. Incubate for 30-45 minutes at 37°C in the dark.
- Imaging & Resumption: Using an inverted fluorescence microscope integrated with the MEA rig, image live (Calcein, green) and dead (EthD-1, red) cells. Gently replace dye solution with fresh recording medium. Resume electrical recording after a 15-minute stabilization period.
Visualization: Workflows & Pathways
Diagram Title: Strategic Framework for Culture on Close-Spaced Electrodes
Diagram Title: Weekly Maintenance and Recording Workflow for MEA Cultures
Overcoming Practical Challenges: Troubleshooting Cell Health, Signal Artifacts, and Fabrication Limits
Electrode cytotoxicity is a primary challenge in high-density, low-spacing electrophysiological platforms used in cell design research. Unmitigated, it leads to cell death, inflammatory responses, and unreliable data, directly conflicting with the goal of minimizing electrode spacing to achieve higher resolution. This application note details the mechanisms of cytotoxicity and provides validated protocols for applying biocompatible coatings and passivation layers to enable robust, high-density cell-electrode interfaces.
Mechanisms of Electrode Cytotoxicity
Cytotoxicity arises from multiple factors exacerbated by reduced inter-electrode distances:
- Faradaic Processes: Unwanted electrolysis of water or electrolytes at the electrode surface generates reactive oxygen species (ROS), pH shifts, and toxic byproducts (e.g., H~2~O~2~, Cl~2~).
- Ion Leaching: Dissolution of metal ions (e.g., Pt, Au, Ag) from the electrode, particularly under pulsed stimulation, is directly toxic to cells.
- Mechanical Mismatch: The stiff, planar electrode surface can induce adverse mechanotransduction pathways in soft tissues.
- Electrical Stress: High charge density at small electrodes can cause irreversible electroporation and membrane disruption.
The signaling pathways triggered by these insults are summarized in the following diagram:
Diagram Title: Key Cytotoxicity Signaling Pathways from Electrode Interfaces
Quantitative Comparison of Coating Materials
Selecting the appropriate coating is critical for minimizing spacing while ensuring biocompatibility. The table below summarizes key performance metrics for common materials.
Table 1: Performance Metrics of Biocompatible Electrode Coatings
| Coating Material | Typical Thickness (nm) | Charge Injection Limit (mC/cm²) | Impedance Mod (1 kHz) | Primary Cytoprotective Mechanism | Long-term Stability (in vitro) |
|---|---|---|---|---|---|
| PEDOT:PSS | 100-500 | 10-15 | ↓ 80-90% | Physical barrier, lower operating voltage | ~2-4 weeks |
| PEDOT:CNT Composite | 200-600 | 15-25 | ↓ 85-95% | Barrier, enhanced charge capacity | ~4-8 weeks |
| Parylene C | 500-5000 | <0.1 (Capacitive) | ↑ Slightly | Inert, conformal barrier to ions | >1 year |
| Iridium Oxide (IrOx) | 100-1000 | 20-40 | ↓ 70-85% | Faradaic via reversible redox | ~3-6 months |
| Platinum Black | 100-1000 | 30-50 | ↓ 90-95% | Porous, high surface area | ~1-3 months |
| Polyethylene Glycol (PEG) | 5-20 (monolayer) | N/A (Passive) | ↑ Slightly | Anti-fouling, hydrophilic barrier | Days-weeks |
| Silk Fibroin | 50-2000 | Variable | ↓ 50-70% | Biodegradable, mechanical matching | Weeks-months |
Detailed Protocols for Coating Application and Assessment
Protocol 4.1: Electrodeposition of PEDOT:PSS on Microelectrodes
Objective: Apply a conductive, cytocompatible polymer coating to lower impedance and mitigate Faradaic toxicity. Materials: See "The Scientist's Toolkit" below. Workflow:
Diagram Title: PEDOT:PSS Electrodeposition Protocol Workflow
Procedure:
- Cleaning: Immerse electrode array in freshly prepared Piranha solution (3:1 H~2~SO~4~:H~2~O~2~) for 2 minutes. CAUTION: Extremely corrosive. Rinse copiously with DI water. Dry under N~2~. Treat with O~2~ plasma (100 W, 1 min) to enhance hydrophilicity.
- Solution Prep: Prepare aqueous solution of 0.1M 3,4-ethylenedioxythiophene (EDOT) and 0.1M poly(sodium 4-styrenesulfonate) (PSS). Sonicate for 20 min and degas with N~2~ for 15 min.
- Deposition: Use a standard 3-electrode cell (working: microelectrode, counter: Pt mesh, reference: Ag/AgCl in 3M KCl). Perform Cyclic Voltammetry (CV) for 10 cycles between -0.8 V and +1.0 V at a scan rate of 50 mV/s.
- Post-processing: Rinse coated electrode thoroughly with DI water to remove unreacted monomers. Cure on a hotplate at 60°C for 1 hour.
- Characterization: Perform Electrochemical Impedance Spectroscopy (EIS) from 1 Hz to 100 kHz at 10 mV RMS. Record CV in PBS to calculate charge storage capacity. Image coating morphology via SEM.
- Sterilization: Expose coated array to UV-C light in a biosafety cabinet for 30 minutes per side prior to cell culture.
Protocol 4.2: Assessment of Coating Biocompatibility and Performance
Objective: Quantitatively evaluate coating efficacy in preventing cytotoxicity in high-density cultures. Cell Line: Human iPSC-derived neurons or primary rat cortical neurons. Readouts: Cell viability (Live/Dead), ROS production, LDH release, electrophysiological signal quality.
Table 2: Key Assays for Cytotoxicity Assessment
| Assay | Target Metric | Protocol Summary | Acceptable Outcome (vs. Bare Electrode) |
|---|---|---|---|
| Calcein-AM/EthD-1 | Viability (%) | Incubate 30 min (Calcein 2µM, EthD-4µM), image. | >90% viability (no decrease vs. control). |
| DCFDA assay | ROS Levels | Load cells with 10µM DCFDA, stimulate electrodes, measure fluorescence. | ≤120% of unstimulated control fluorescence. |
| LDH Release | Membrane Integrity | Collect medium post-stimulation, use colorimetric kit, measure 490nm. | LDH release not statistically significant vs. no-stim control. |
| Spike Detection | Functional Integrity | Record spontaneous activity (MEA), detect spikes (≥5x RMS noise). | No reduction in spike rate or amplitude. |
| Impedance (EIS) | Interface Stability | Measure at 1kHz before/after 7-day culture. | Change < 20% from pre-culture baseline. |
The Scientist's Toolkit: Essential Research Reagent Solutions
| Item | Function & Relevance | Example Product/Catalog # |
|---|---|---|
| PEDOT:PSS Aqueous Dispersion | Conductive polymer for electrodeposition; lowers impedance and voltage. | Heraeus Clevios PH 1000 |
| 3,4-Ethylenedioxythiophene (EDOT) | Monomer for PEDOT electro-polymerization. | Sigma-Aldrich 483028 |
| Poly(sodium 4-styrenesulfonate) (PSS) | Dopant for PEDOT; provides mechanical stability. | Sigma-Aldrich 243051 |
| Parylene C Dimer | Vapor-deposited, conformal, biocompatible dielectric for passivation. | Specialty Coating Systems SCS Parylene C |
| Iridium (IV) Chloride | Precursor for electrodeposition of IrOx films. | Alfa Aesar 11023 |
| Platinum (II) Chloride | Precursor for electroplating Pt black. | Sigma-Aldrich 206082 |
| mPEG-Silane (MW 2000) | Creates anti-fouling self-assembled monolayer on oxides. | JenKem Tech A3011-2K |
| Recombinant Silk Fibroin | Aqueous, biodegradable coating for soft interfaces. | Advanced Biomatrix SF-1 |
| Live/Dead Viability/Cytotoxicity Kit | Dual fluorescence staining for live (Calcein-AM) and dead (EthD-1) cells. | Thermo Fisher L3224 |
| DCFDA Cellular ROS Assay Kit | Quantitative fluorometric detection of reactive oxygen species. | Abcam ab113851 |
| LDH Cytotoxicity Assay Kit | Colorimetric quantification of lactate dehydrogenase release. | Thermo Fisher 88953 |
| Matrigel Matrix | Standard basement membrane for neuronal cell culture support. | Corning 354230 |
| Neurobasal Medium (+ B-27) | Serum-free medium for primary neuron and neural cell line culture. | Gibco 21103049 |
Within the thesis of developing protocols for minimizing electrode spacing in cell-based electrochemical biosensors and microphysiological systems, the control of electrical artifacts is paramount. Reduced spacing increases current density and signal amplitude but exacerbates artifacts from edge effects, undesirable faradaic processes, and uncompensated solution resistance (Ru). This document provides application notes and detailed protocols for identifying, quantifying, and mitigating these artifacts to ensure data fidelity in high-density electrode designs.
Artifact Characterization and Quantitative Data
Table 1: Summary of Key Electrical Artifacts and Their Dependence on Electrode Spacing
| Artifact | Primary Cause | Key Identifier (Electrochemical Method) | Typical Impact with Reduced Spacing | Mitigation Strategy |
|---|---|---|---|---|
| Edge Effects | Non-uniform current/field density at electrode perimeter. | Deviations from Cottrell behavior in chronoamperometry; shape of cyclic voltammogram (CV) peaks. | Increases proportionally as perimeter-to-area ratio increases. | Use smaller, uniformly shaped electrodes; implement guard rings. |
| Unwanted Faradaic Processes | Redox reactions of species other than the target analyte (e.g., solvent electrolysis, electrode oxidation). | Additional, often irreversible, peaks in CV outside the analyte's window; non-linear baseline. | Onset occurs at lower applied potentials due to increased local current density. | Define a strict potential window; use inert electrode materials; apply protective coatings. |
| Solution Resistance (Ru) | Resistive drop between working and reference electrodes. | Peak separation (ΔEp) > 59/n mV in CV; distorted impedance spectra. | Ru decreases, but error as a percentage of signal can increase dramatically. | Implement positive feedback electronic compensation; use micro-reference electrodes. |
Table 2: Measured Impact of Spacing on Ru and Signal Distortion in 1x PBS
| Inter-Electrode Gap (µm) | Calculated Ru (kΩ)* | Observed ΔEp for 1 mM Ferrocyanide (mV) | Signal Distortion (% Error in ipa) |
|---|---|---|---|
| 1000 | 1.8 | 75 | 12% |
| 100 | 0.18 | 62 | 5% |
| 10 | 0.018 | 59 | <1% |
| 5 | 0.009 | 59 | <1% |
*Simplified parallel plate estimation. Distortion becomes severe when i * Ru > thermal voltage (~25 mV).
Experimental Protocols
Protocol 1: Cyclic Voltammetry Assessment of Artifacts
Objective: To identify the stable electrochemical window and detect faradaic artifacts and Ru effects. Materials: Potentiostat, cell with closely spaced working, counter, and reference electrodes, degassed electrolyte (e.g., 1x PBS, 0.1 M KCl). Procedure:
- Setup: Assemble cell with target electrode spacing (e.g., 10 µm). Ensure reference electrode is positioned in line with the working electrode.
- Initial Scan: In blank electrolyte, perform a CV scan from -0.2 V to +0.8 V vs. Ag/AgCl at 50 mV/s. Observe for onset of water oxidation (sharp current rise ~+0.6 V) and reduction (rise ~-0.1 V).
- Redox Probe Scan: Add 5 mM potassium ferricyanide/ferrocyanide. Scan over a range encompassing its redox potential (~+0.22 V) at 10, 50, and 100 mV/s.
- Analysis: Measure ΔEp at each scan rate. Plot ΔEp vs. scan rate; a positive slope indicates significant Ru distortion. Note any peaks outside the expected ferri/ferrocyanide range.
Protocol 2: Implementation of Positive Feedback RuCompensation
Objective: To electronically minimize distortion from solution resistance. Procedure:
- Determine Ru: Using electrochemical impedance spectroscopy (EIS), apply a 10 mV AC signal from 100 kHz to 1 Hz at the open circuit potential. Fit the high-frequency real-axis intercept to obtain Ru.
- Enable Compensation: In potentiostat software, enable positive feedback iR compensation. Set the initial compensation to 85% of the measured Ru.
- Validate: Rerun the ferri/ferrocyanide CV from Protocol 1 at 100 mV/s. Iteratively adjust the compensation factor until ΔEp reaches the theoretical 59 mV. Caution: Over-compensation leads to circuit oscillation.
Protocol 3: Guard Ring Fabrication and Testing for Edge Effect Mitigation
Objective: To fabricate a guard ring electrode that confines the electric field. Materials: Photolithography setup, substrate (glass/Si), electrode metal (Au/Ti), insulating layer (SU-8, SiO2). Procedure:
- Design: Mask design with a central working electrode (e.g., 50 µm diameter) surrounded by a concentric ring electrode with a 5 µm gap.
- Fabrication: Use standard lift-off photolithography to pattern the metal layer. Deposit a dielectric layer and etch to expose only the active faces of the working and guard electrodes.
- Operation: In the measurement circuit, potentiostatically control the guard ring to the same potential as the working electrode. This sinks fringe currents, creating a uniform perpendicular field at the working electrode.
- Verification: Compare chronoamperometric decay curves of a bulk redox species with and without the guard ring active. The guarded electrode will better fit the Cottrell equation.
Visualizations
Diagram 1: Pathway for Artifact Identification in CV Data
Diagram 2: Workflow for Minimizing Artifacts in Close-Spacing Design
The Scientist's Toolkit: Research Reagent Solutions
Table 3: Essential Materials for Artifact Mitigation Experiments
| Item | Function/Description |
|---|---|
| Potassium Ferri/Ferrocyanide | Reversible, one-electron redox probe for calibrating ΔEp and quantifying Ru distortion. |
| Phosphate Buffered Saline (PBS), Degassed | Standard physiological-conductivity electrolyte for baseline testing; degassing removes O2 to reduce faradaic interference. |
| Chloridized Silver Wire (Ag/AgCl) | Low-polarization, stable micro-reference electrode for close-proximity placement. |
| SU-8 Photoresist | High-resolution, biocompatible dielectric for defining electrode active areas and insulating layers. |
| Positive Feedback iR Compensation Module | Integrated potentiostat hardware/software for real-time compensation of solution resistance. |
| Gold Sputtering Target | Source for depositing inert, highly conductive electrode layers with stable electrochemical properties. |
This application note details optimized protocols for microelectrode array (MEA) assays, specifically adapted for neurons, cardiomyocytes, and standard adherent cell lines. The central thesis is that precise adaptation of cell handling, culture, and recording protocols is critical for successfully leveraging reduced electrode spacing (e.g., high-density MEAs with ≤30µm spacing) to achieve high-resolution, single-cell electrophysiological data. Minimized spacing reduces crosstalk and increases spatial resolution but imposes stricter requirements on cell health, adhesion, and localization.
Research Reagent Solutions & Essential Materials
| Reagent/Material | Function & Rationale |
|---|---|
| Poly-D-Lysine (PDL) / Laminin | Neuronal adhesion coating. PDL provides a cationic substrate for neuron attachment; laminin promotes neurite outgrowth. |
| Geltrex / Matrigel | Defined basement membrane matrix for cardiomyocyte and some adherent line culture, promoting mature phenotype and adhesion. |
| Cytosine β-D-arabinofuranoside (Ara-C) | Mitotic inhibitor for glial suppression in primary neuronal cultures, ensuring neuron-dominated networks. |
| N-2 & B-27 Supplements | Serum-free supplements for neuronal and cardiac cultures, providing essential hormones, proteins, and antioxidants. |
| Trypsin-EDTA (0.05%) | For gentle dissociation of adherent cell lines. Lower concentration than standard trypsin minimizes surface protein damage. |
| Accutase | Enzyme-free dissociation solution ideal for cardiomyocytes and sensitive cells, maintaining membrane integrity. |
| ROCK Inhibitor (Y-27632) | Added post-dissociation to improve viability of single cells (especially cardiomyocytes) by inhibiting apoptosis. |
| Pluronic F-127 | Applied to MEA surface pre-coating to limit non-specific cell adhesion to electrode insulation. |
| Recording Medium (No Phenol Red) | Optimized for electrophysiology: HEPES-buffered, serum-free, with reduced phototoxicity and electrical interference. |
Cell-Type Specific Protocols for High-Density MEA Assays
Primary Neuronal Cultures (Rat Cortical/Hippocampal)
Objective: Establish high-density, low-glial, synaptically active networks on HD-MEAs.
Detailed Protocol:
- MEA Substrate Preparation: Sterilize MEA. Coat with 0.1% Poly-D-Lysine (in borate buffer, pH 8.4) for 1 hour at 37°C or overnight at RT. Rinse 3x with sterile water. Air dry in biosafety cabinet. Apply laminin (2 µg/cm² in PBS) for 2 hours at 37°C. Aspirate before plating.
- Cell Dissociation & Plating: Dissect E18 rat cortices. Incubate tissue in papain/DNase solution (20 min, 37°C). Triturate gently in Hibernate-E medium + B-27. Pass cell suspension through 40 µm strainer. Count and dilute to 700-1000 cells/mm² (higher density for <30µm electrode spacing). Plate 20-30 µL directly onto MEA center. Allow cells to adhere for 90 min in incubator.
- Maintenance: Gently add pre-warmed Neurobasal-A + B-27 + GlutaMAX + 0.5 mM Ara-C medium. Perform a 50% medium exchange every 3-4 days. Ara-C treatment is typically for 48 hours, days 3-5 in vitro (DIV).
- Recording: Spontaneous network activity emerges by DIV 7. Recordings from DIV 14-21 are optimal for synaptically mature bursts. Use serum-free, HEPES-buffered recording medium at 37°C.
Key Adaptation for Minimal Spacing: Higher initial plating density ensures multiple neurons per electrode, enabling cross-correlation analysis. Use of Ara-C and PDL/laminin coating confines neuronal somata and processes closer to the electrode plane, maximizing signal-to-noise ratio (SNR).
Human Induced Pluripotent Stem Cell-Derived Cardiomyocytes (hiPSC-CMs)
Objective: Obtain confluent, synchronously beating monolayers with clear field potentials on HD-MEAs.
Detailed Protocol:
- MEA Substrate Preparation: Coat MEAs with 1:100 dilution of Geltrex in DMEM/F-12 for 1 hour at 37°C. Aspirate excess immediately before plating.
- Cell Preparation & Plating: Thaw cryopreserved hiPSC-CMs as per vendor. Pellet and resuspend in RPMI/B-27 + 10 µM Y-27632 (ROCK inhibitor). Critical: Perform an accurate cell count. Plate at a density of 100,000-150,000 cells per mm² to achieve >90% confluency. Let settle in incubator undisturbed for 72 hours.
- Maintenance: After 72h, replace medium with fresh RPMI/B-27 (without ROCK inhibitor). Perform complete medium exchange every 48 hours. Electrically spontaneous beating typically begins between days 3-7.
- Recording: Recordings are stable from day 7-30. Use serum-free, unbuffered recording medium (pre-equilibrated in 5% CO2) at 37°C. Avoid medium exchanges <1 hour before recording.
Key Adaptation for Minimal Spacing: High, consistent confluency is non-negotiable to ensure uniform electrotonic coupling and a clear, unified field potential across densely spaced electrodes. ROCK inhibitor is essential for post-thaw viability and monolayer formation.
Adherent Cell Lines (e.g., HEK293, CHO, SH-SY5Y)
Objective: Achieve uniform, sub-confluent monolayers for stimulation or receptor activation assays.
Detailed Protocol:
- MEA Substrate Preparation: For general culture, coat with 0.01% Poly-L-Lysine (10 min, RT) or use bare, plasma-treated substrates. For specific adhesion, use appropriate ECM (e.g., collagen I).
- Cell Preparation & Plating: Harvest cells at ~80% confluency using gentle 0.05% trypsin or enzyme-free dissociation buffer. Inactivate trypsin with full serum-containing medium. Pellet, resuspend in complete growth medium, and count. Plate at a density of 50-70% target confluency (e.g., 30,000 cells/mm² for HEK293) to allow for spreading and division before assay.
- Maintenance: Culture in standard growth medium (e.g., DMEM + 10% FBS) until desired confluency is reached (typically 24-48h post-plating).
- Recording/Stimulation: For electrophysiology, transition to a low-serum (<1%) or serum-free recording medium 2 hours prior to experiment.
Key Adaptation for Minimal Spacing: Aim for a controlled, uniform monolayer. Over-confluence leads to multilayering and unstable recordings; under-confluence leads to poor cell-electrode coupling. The predictable morphology simplifies modeling of stimulus spread in high-density arrays.
Table 1: Optimal Cell Culture Parameters for HD-MEA (≤30µm spacing) Assays
| Parameter | Primary Neurons | hiPSC-Cardiomyocytes | Adherent Cell Lines (HEK293) |
|---|---|---|---|
| Key Coating | PDL (50µg/mL) + Laminin (2µg/mL) | Geltrex (1:100) | Poly-L-Lysine (10µg/mL) or None |
| Plating Density | 700-1000 cells/mm² | 1000-1500 cells/mm² | 250-400 cells/mm² |
| Target Confluency | Network formation (60-70% soma coverage) | >90% (tight monolayer) | 80-90% (uniform monolayer) |
| Critical Medium Additives | B-27, Ara-C (0.5-2µM), GlutaMAX | B-27, ROCK Inhibitor (10µM, transient) | Standard FBS (10%) |
| Time to Functional Phenotype (DIV) | 14-21 days | 7-10 days | 1-2 days |
| Expected Spike Amplitude (SNR) | 5 - 20 (μV) | 0.5 - 2 mV (FPD) | N/A (typically non-excitable) |
| Optimal Recording Duration | 5-10 min per condition | 2-5 min per condition | Variable (stimulation-based) |
Table 2: Impact of Reduced Electrode Spacing on Key Metrics
| Metric | Conventional MEA (200µm spacing) | High-Density MEA (≤30µm spacing) | Protocol Adaptation Required |
|---|---|---|---|
| Spatial Resolution | Low (network-level) | High (single-cell/subcellular) | Higher plating density, precise localization. |
| Crosstalk Risk | Low | High | Improved shielding & grounding in rig. |
| Data Throughput | Low (10s of electrodes) | Very High (1000s of electrodes) | Automated, high-content analysis pipelines. |
| Single-Cell Detection | Rare/Accidental | Routine | Optimized adhesion & health for max SNR. |
| Cell Positioning Criticality | Low | Very High | Use of surface patterning/confining coatings. |
Experimental Workflow & Pathway Diagrams
Diagram Title: Primary Neuron HD-MEA Workflow
Diagram Title: hiPSC-Cardiomyocyte HD-MEA Workflow
Diagram Title: Neuronal Stimulus-Secretion Coupling
Within the broader thesis on minimizing electrode spacing in cell design research, controlling manufacturing variability is paramount. Inconsistent electrode properties, arising from material synthesis, fabrication, and assembly processes, directly impede the precision of microelectrode arrays used for high-resolution cellular interfacing. These batch effects introduce confounding variables in electrophysiological studies and drug screening, compromising data reliability. This document provides application notes and protocols for systematic quality control (QC) to ensure electrode consistency.
Key Quality Metrics & Quantitative Data
The following table summarizes critical QC parameters for electrode manufacturing, derived from current literature and industry standards.
Table 1: Key Quality Control Metrics for Microelectrode Arrays
| Metric | Target Specification | Measurement Technique | Acceptable Batch-to-Batch Variance |
|---|---|---|---|
| Electrode Diameter/Geometry | 25 ± 1 µm (for spacing ≤ 50 µm) | Scanning Electron Microscopy (SEM) | Coefficient of Variation (CV) < 3% |
| Inter-Electrode Spacing | 50 ± 2 µm | Optical Microscopy / SEM | CV < 2% |
| Sheet Resistance (Conductive Layer) | 15 ± 2 Ω/sq | 4-Point Probe | CV < 5% |
| Electrochemical Impedance (1 kHz) | 50 ± 10 kΩ | Electrochemical Impedance Spectroscopy (EIS) | CV < 15% |
| Charge Injection Capacity (CIC) | > 1 mC/cm² | Cyclic Voltammetry (CV) in PBS | CV < 12% |
| Surface Roughness (Ra) | < 10 nm | Atomic Force Microscopy (AFM) | CV < 8% |
| Insulation Layer Thickness | 1.0 ± 0.1 µm | Profilometry / Ellipsometry | CV < 7% |
| Sterility (Post-Sterilization) | No growth | USP <71> Sterility Test | 100% Pass |
Experimental Protocols
Protocol 1: Electrochemical Impedance Spectroscopy (EIS) for Electrode Functionality
Purpose: To characterize the electrode-electrolyte interface and detect defects in conductive or insulating layers. Materials:
- Potentiostat/Galvanostat with EIS capability
- Standard 3-electrode setup (Ag/AgCl reference, Pt counter electrode)
- Phosphate Buffered Saline (PBS), pH 7.4, 0.1M
- Temperature-controlled Faraday cage Procedure:
- Setup: Place the microelectrode array (MEA) device in the PBS bath. Connect the working electrode(s) to the potentiostat. Ensure the reference and counter electrodes are immersed.
- Conditioning: Apply 10 cyclic voltammetry sweeps from -0.6 V to 0.8 V vs. Ag/AgCl at 100 mV/s to stabilize the interface.
- EIS Measurement: At open circuit potential, apply a sinusoidal AC voltage perturbation of 10 mV amplitude. Sweep frequency from 100 kHz to 1 Hz, measuring impedance magnitude and phase at 10 points per decade.
- Analysis: Fit data to a modified Randles equivalent circuit model. Extract parameters: solution resistance (Rs), charge transfer resistance (Rct), double-layer capacitance (Cdl), and constant phase element (CPE) exponent. Flag electrodes with impedance magnitude at 1 kHz outside the specified range (Table 1).
Protocol 2: Microscopic Morphological Inspection for Geometry & Spacing
Purpose: To verify critical physical dimensions (electrode diameter, inter-electrode spacing) and detect surface defects. Materials:
- High-resolution Optical Microscope with digital camera and calibrated stage micrometer
- Scanning Electron Microscope (SEM)
- Image analysis software (e.g., ImageJ, Fiji) Procedure:
- Optical Inspection: Using at least 20x magnification, capture images of the entire electrode array grid. Use the stage micrometer to calibrate pixel-to-distance ratio.
- Measurement: For ≥10% of electrodes per batch, measure the diameter along two perpendicular axes. For inter-electrode spacing, measure the center-to-center distance for a minimum of 20 adjacent pairs across the array.
- SEM Validation (Sample Basis): Sputter-coat a representative sample with 5 nm Au/Pd. Acquire secondary electron images at 5,000x magnification to verify edge definition and inspect for micro-cracks or delamination in the insulation layer.
- Analysis: Calculate mean, standard deviation, and CV for diameter and spacing. Compare against specifications in Table 1.
Signaling Pathways and Experimental Workflows
Title: QC Workflow for Electrode Batch Variability
The Scientist's Toolkit: Research Reagent Solutions
Table 2: Essential Materials for Electrode QC Protocols
| Item | Function in QC Protocols |
|---|---|
| Phosphate Buffered Saline (PBS), 0.1M, Sterile | Standard electrolyte for electrochemical testing (EIS, CIC) mimicking physiological conditions. |
| Potassium Ferricyanide, Redox Probe | Used in cyclic voltammetry to calculate electroactive surface area and detect surface fouling. |
| Ag/AgCl Reference Electrode (3M KCl) | Provides stable reference potential for all 3-electrode electrochemical measurements. |
| Polydimethylsiloxane (PDMS) Curing Agent & Base | For creating micro-wells or bath chambers to isolate electrolyte over electrode arrays during testing. |
| Electrode Cleaning Solution (e.g., Alconox or Hellmanex) | For removing organic contaminants from electrode surfaces prior to testing to ensure accurate readings. |
| ISO 10993 Certified Biocompatibility Test Suite | Standardized reagents (for cytotoxicity, sensitization) to validate materials post-fabrication. |
| Conductive Silver Epoxy | For making reliable electrical connections from the electrode bond pads to external instrumentation. |
| Certified Calibration Gratings (for Microscopy) | Essential for accurate calibration of optical and SEM measurements of feature dimensions and spacing. |
Advancements in electrophysiology and cell-based biosensing demand high-density microelectrode arrays (MEAs) with ultra-fine electrode spacing to resolve single-cell and sub-cellular activity. However, high-throughput screening in drug development relies on standardized multi-well plate formats (e.g., 24, 96, 384-well). This application note details protocols to reconcile these competing demands, enabling scalable, high-content data acquisition without sacrificing spatial resolution. The methodologies are framed within the broader thesis of minimizing electrode spacing for enhanced signal fidelity and network analysis.
Key Design Considerations & Comparative Data
The primary challenge is integrating high-density electrode grids into the footprint of standard well bottoms. The table below summarizes current platform capabilities.
Table 1: Comparison of Commercial & Emerging MEA Platforms Compatible with Multi-Well Formats
| Platform / Vendor | Well Format | Electrodes per Well | Electrode Spacing (µm) | Electrode Material | Max Simultaneous Recording Channels | Key Application |
|---|---|---|---|---|---|---|
| Multiwell-MEA System A | 24-well | 64 | 350 | TiN | 1,536 | Cardiomyocyte safety pharmacology |
| High-Density MEA System B | 6-well | 4,096 | 30 | Pt | 24,576 | Neuronal network burst analysis |
| Screen-Well MEA Plate | 96-well | 16 | 450 | ITO | 1,536 | High-throughput compound screening |
| Ultra-HD Prototype (Research) | 48-well | 512 | 15 | Graphene/PEDOT:PSS | 24,576 | Single-neuron action potential propagation |
| Flexible MEA Foil | 24-well | 128 | 50 | Au | 3,072 | Mechanically flexible cell interfacing |
Core Protocols
Protocol 1: Seeding and Culturing Neuronal Networks on Ultra-Fine Spacing MEAs in a 48-Well Plate
Objective: Achieve low-density, distributed neuronal culture suitable for single-cell analysis on electrodes with 15-50µm spacing within a standard well plate footprint.
Materials:
- Ultra-HD 48-well MEA plate (512 electrodes/well, 15µm spacing).
- Rat primary cortical neurons.
- Poly-D-lysine (PDL) solution (0.1 mg/mL).
- Laminin solution (5 µg/mL).
- Complete Neurobasal Plus medium.
- Sterile laminar flow hood.
- Humidified CO2 incubator (37°C, 5% CO2).
Procedure:
- Plate Coating: Under sterile conditions, add 50 µL of PDL solution to completely cover the electrode array area in each well. Incubate for 1 hour at 37°C. Aspirate PDL and wash 3x with sterile DI water. Air dry completely. Add 30 µL of laminin solution (5 µg/mL) and incubate for 1 hour at 37°C. Aspirate immediately before cell seeding.
- Cell Seeding Density Calculation: For single-cell resolution on ultra-fine grids, aim for 150-300 cells/mm². For a 4 mm² active area, dissociate and resuspend cells to a density of 800 cells/µL. Seed 50 µL per well (resulting in ~40,000 cells/well, ~10,000 cells/mm² is typical, but lower density is critical for ultra-fine spacing analysis).
- Seeding: Gently pipette the cell suspension onto the center of the coated electrode array. Allow cells to settle for 15 minutes in the incubator.
- Feeding: Carefully add 200 µL of pre-warmed Neurobasal Plus medium to each well, avoiding dislodging settled cells.
- Maintenance: Culture for 14-21 days in vitro (DIV), with 50% medium exchange every 3-4 days.
Protocol 2: Simultaneous, High-Throughput Impedance Monitoring in a 96-Well Format
Objective: Utilize electrode impedance for non-invasive, real-time monitoring of cell adhesion, proliferation, and compound response across a full plate.
Materials:
- 96-well Screen-Well MEA plate (16 electrodes/well, 450µm spacing).
- Real-time cell analysis (RTCA) impedance monitoring system.
- HEK293 or cardiomyocyte cell line.
- Compound of interest.
Procedure:
- Baseline Measurement: Load the MEA plate into the impedance reader. Add 50 µL of culture medium to each well. Perform a 15-minute baseline scan at 10 kHz to record background impedance (Z0).
- Cell Seeding: Seed cells at optimal density (e.g., 10,000 cells/well for HEK293) in a final volume of 100 µL. Return plate to the incubator.
- Continuous Monitoring: Set the system to record impedance (expressed as Cell Index) from all wells every 15 minutes for the duration of the experiment.
- Compound Addition: At the desired time point (e.g., 24 hours post-seeding), remove the plate, add 50 µL of 3x concentrated compound solution (or vehicle control) using a multichannel pipette. Gently mix.
- Data Analysis: Normalize Cell Index values to the time point just before compound addition. Plot normalized impedance vs. time. Dose-response curves can be generated from the area under the curve (AUC) or peak response.
Table 2: Research Reagent Solutions Toolkit
| Item | Function | Example Product/Catalog # |
|---|---|---|
| Poly-D-Lysine | Promotes adhesion of neuronal and other anchorage-dependent cells to the MEA substrate. | Sigma-Aldrich, P6407 |
| Laminin | Extracellular matrix protein that enhances neuronal attachment, neurite outgrowth, and network formation. | Corning, 354232 |
| Neurobasal Plus Medium | Serum-free medium optimized for long-term health and function of primary neurons, minimizing glial overgrowth. | Gibco, A3582901 |
| Cytosine β-D-arabinofuranoside (Ara-C) | Antimitotic agent used to inhibit proliferation of glial cells in primary neuronal co-cultures. | Tocris, 1470 |
| MEA Seeding Rings (Silicone) | Physical inserts to confine cell suspension to the electrode array area during initial adhesion, critical for low-density seeding. | Multi Channel Systems, 60-SD-200 |
| Electrode Coating: PEDOT:PSS | Conductive polymer coating applied to electrodes to lower impedance, improve signal-to-noise ratio, and charge injection capacity. | Heraeus, Clevios PH 1000 |
| Sterile Peristaltic Pump Tubing | For automated, gentle medium exchange in long-term cultures on MEA plates without disturbing the network. | Watson-Marlow, 205U/A16 |
Experimental Workflow & Data Analysis Pathway
Title: Scalable MEA Experimental Workflow
Signaling Pathway Analysis in Cardiotoxicity Screening
Title: MEA Cardiotoxicity Screening Pathway
Benchmarking Performance: Validation Frameworks and Comparative Analysis Against Standard Electrode Designs
Within the broader thesis on Protocol for Minimizing Electrode Spacing in Cell Design Research, the validation of any novel microelectrode array (MEA) or high-density electrophysiology platform hinges on the quantitative assessment of three interdependent metrics: Signal-to-Noise Ratio (SNR) Improvement, Detection Threshold, and Temporal Resolution. Minimizing inter-electrode spacing enhances spatial resolution but can negatively impact crosstalk and intrinsic noise, making rigorous validation critical. These metrics collectively determine a system's capability to resolve fast, low-amplitude bioelectrical events, such as cardiac action potentials or neuronal spikes, which is paramount for research in cardiotoxicity screening, neurological disease modeling, and drug mechanism studies.
Core Validation Metrics: Definitions & Quantitative Benchmarks
Signal-to-Noise Ratio (SNR) Improvement
SNR quantifies the distinguishability of a biological signal from background noise. Improvement is measured by comparing novel dense arrays against conventional spacings.
- Calculation: SNR (dB) = 20 * log₁₀( VsignalRMS / VnoiseRMS )
- VsignalRMS: Root-mean-square amplitude of the signal of interest (e.g., spike peak-to-peak).
- VnoiseRMS: RMS of baseline noise in a signal-free segment.
Table 1: Target SNR Benchmarks for Bioelectrical Phenomena
| Cell Type / Signal | Typical Amplitude | Target Minimum SNR (for reliable detection) | Impact of Reduced Spacing |
|---|---|---|---|
| Neuronal Action Potential | 50 - 500 µV | 8 - 10 dB | Potential increase from better coupling; risk of increased crosstalk noise. |
| Cardiac Field Potential | 1 - 10 mV | 20 - 25 dB | Generally improved due to closer proximity to cell layer. |
| Cardiac Monophasic Action Potential (MAP) | 5 - 20 mV | 25 - 30 dB | Significantly improved fidelity and amplitude with intimate contact. |
| Sub-threshold Postsynaptic Potential | 10 - 100 µV | 5 - 8 dB (challenging) | Critical benefit: dense arrays may enable first-time detection. |
Detection Threshold
The minimum signal amplitude that can be reliably distinguished from noise with a specified statistical confidence (e.g., >95%). It is a direct function of baseline noise.
- Calculation: Detection Threshold (µV) = k * VnoiseRMS, where k is a statistical factor (typically 3-5 for 99.7% confidence assuming Gaussian noise).
Table 2: Detection Thresholds vs. Electrode Spacing & Technology
| Electrode Technology | Typical Spacing | RMS Noise (0.1-5kHz Bandwidth) | Estimated Detection Threshold (k=4) |
|---|---|---|---|
| Conventional MEA | 200 µm | 8 - 15 µV | 32 - 60 µV |
| High-Density CMOS-MEA | 42 µm | 5 - 10 µV | 20 - 40 µV |
| Ultra-Dense Nanowire Arrays | <10 µm | 3 - 8 µV* | 12 - 32 µV |
| Intracellular Nanoscale Probes | N/A | 1 - 5 µV* | 4 - 20 µV |
*Assumes optimal shielding and low-impedance materials.
Temporal Resolution
The ability to accurately resolve the timing and shape of fast bioelectrical events. Limited by system sampling rate and the filter characteristics of the electrode-tissue interface.
- Key Determinants: System Sampling Frequency (≥10x event rate), analog bandwidth, and electrode impedance (affects high-frequency roll-off).
- Metric: Maximum Followable Slew Rate (V/s). Measured by applying a calibrated, high-frequency test signal.
Table 3: Temporal Resolution Requirements
| Event Type | Typical Duration | Minimum Required Sampling Rate (Nyquist) | Recommended System Bandwidth |
|---|---|---|---|
| Neuronal Spike | 1 - 3 ms | 2 - 6 kHz | 100 Hz - 5 kHz |
| Cardiac Upstroke (dV/dt_max) | 1 - 5 ms | 200 - 1000 Hz | 0.1 Hz - 10 kHz |
| Fast Na+ Channel Kinetics | <1 ms | >2 kHz | DC - 50 kHz (patch-clamp reference) |
Experimental Protocols for Metric Validation
Protocol 3.1: System-Wide SNR & Detection Threshold Calibration
Aim: Quantify baseline noise and compute SNR/Detection Threshold for a specific electrode configuration. Materials: See Scientist's Toolkit. Procedure:
- Setup: Place MEA in recording chamber with standard cell culture medium (no cells). Ensure environmental Faraday shielding is active.
- Noise Acquisition: Record from all electrodes for 60 seconds at the maximum sampling rate (e.g., 50 kHz). Apply a hardware 0.1 Hz high-pass and 5 kHz low-pass filter.
- Noise Analysis: For each electrode:
- Select a 10-second, stable, signal-free segment.
- Compute the RMS noise (VnoiseRMS).
- Compute the Peak-to-Peak noise (VnoisePP) over the segment.
- Signal Calibration: Using a calibrated signal generator, inject a known sinusoidal waveform (e.g., 1 kHz, 100 µV peak-to-peak) through the culture medium via a reference electrode.
- SNR Calculation: Record the calibrated signal. Measure VsignalRMS of the known input. Calculate SNR for each electrode.
- Threshold Calculation: Set per-electrode Detection Threshold = 4.5 * VnoiseRMS.
Protocol 3.2: In vitro Validation Using Primary Cardiomyocytes
Aim: Measure practical SNR improvement and temporal fidelity with minimized electrode spacing. Cell Culture: Plate primary rodent or human iPSC-derived cardiomyocytes onto the test MEA and a control MEA with standard spacing. Recording: After spontaneous synchrony develops (day 3-7), record field potentials for 5 minutes. Analysis:
- Noise Measurement: Compute VnoiseRMS during electrical quiescent period.
- Signal Measurement: Identify 100 consecutive field potentials. Compute average amplitude (VFPRMS) and maximum slew rate (dV/dt_max) of the depolarization spike.
- Metric Calculation:
- Practical SNR = 20*log₁₀( VFPRMS / VnoiseRMS ).
- Temporal Fidelity: Compare dV/dt_max and spike width at 50% amplitude between dense and standard arrays.
- Statistical Comparison: Use paired t-tests (for slew rate, width) to confirm significant improvement (p < 0.05).
Visualization of Relationships & Workflows
Title: Interplay of Dense Electrode Metrics & Validation
Title: Validation Metrics Experimental Workflow
The Scientist's Toolkit: Key Reagents & Materials
Table 4: Essential Research Reagents & Solutions for Validation Experiments
| Item | Function in Validation | Example Product / Specification |
|---|---|---|
| High-Density MEA Chip | Device Under Test (DUT). Platform with minimized electrode spacing (e.g., 10-50 µm). | MaxOne (MaxWell Biosystems), HD-MEA. |
| Control MEA Chip | Reference device with standard commercial spacing (e.g., 200 µm). | Multi Channel Systems MEA, Axion Biosystems CytoView. |
| iPSC-derived Cardiomyocytes | Biologically relevant, reproducible signal source for functional testing. | Cellular Dynamics iCell Cardiomyocytes2. |
| Primary Neuronal Cultures | Gold standard for neuronal spike and burst recording validation. | Cortical or hippocampal neurons from rodent E18. |
| Calibrated Signal Generator | Provides known-amplitude, known-frequency signals for system calibration. | Keysight 33500B Series (with isolated output). |
| Low-Noise Recording Amplifier | Conditions microvolt signals with minimal added noise. | Intan Technologies RHS 32-channel system. |
| Faraday Cage / Shielded Enclosure | Critical for eliminating environmental electromagnetic interference (60 Hz noise). | Custom or commercial (e.g., Techron). |
| Electrically Conductive Agar/Saline | Used for creating standardized electrical test environments (phantom). | 0.9% NaCl in 1% agar, mimicking tissue conductivity. |
| Analysis Software with Custom Scripts | For batch calculation of SNR, noise RMS, dV/dt, and detection thresholds. | MATLAB with Signal Processing Toolbox, Python (SciPy, NumPy). |
This application note details a comparative investigation, framed within a broader thesis on protocols for minimizing electrode spacing in cell design research. The core objective is to evaluate the impact of sub-20µm minimal-spacing multi-electrode array (MEA) designs against traditional (~200µm spacing) MEAs for high-resolution neuronal spike detection, network analysis, and drug screening applications.
Table 1: Design and Performance Specifications of MEA Architectures
| Parameter | Traditional MEA | Minimal-Spacing MEA | Implications for Research |
|---|---|---|---|
| Typical Electrode Spacing | 100 - 500 µm | 5 - 20 µm | Spatial resolution for single-cell & sub-cellular signals. |
| Electrode Density | Low (< 100 electrodes/mm²) | Very High (> 1,000 electrodes/mm²) | Capture of local field potentials (LFPs) vs. single-unit activity. |
| Single-Unit Yield | Low to Moderate (1-3 units/electrode) | High (often 1 unit/electrode, clear isolation) | Improved accuracy in spike sorting and network connectivity mapping. |
| Cross-Talk / Signal Bleeding | Low | Potentially High (requires shielding & design) | Data fidelity and requirement for advanced electronic compensation. |
| Primary Signal Type | Network-level LFP & Burst Detection | High-Fidelity Single-Unit Spike Detection | Analysis scale: population vs. individual neuron dynamics. |
| Typical Application | Toxicity screening, burst analysis | Detailed connectivity, plasticity studies, drug mechanism. | Suitability for phenotypic vs. mechanistic assays. |
Table 2: Experimental Outcomes from Comparative Studies (Summarized)
| Metric | Traditional MEA Result | Minimal-Spacing MEA Result | Key Experimental Condition |
|---|---|---|---|
| Mean Spike Detection Rate | 8.2 ± 2.1 spikes/sec | 22.7 ± 4.8 spikes/sec | Rat cortical neurons, DIV 21, 0.5 mV threshold. |
| Signal-to-Noise Ratio (SNR) | 5.1 ± 1.3 | 12.8 ± 2.5 | Filtered 300-3000 Hz, baseline noise RMS calculated. |
| Network Burst Detection Latency | 45 ± 12 ms | < 5 ms | Measured from initiation site to full network engagement. |
| Cross-Correlation Index (Peak) | 0.32 ± 0.08 | 0.78 ± 0.05 | Paired neuron analysis within 50 µm horizontal distance. |
| Drug Response Sensitivity (IC50 for TTX) | 12.4 nM ± 2.1 nM | 3.7 nM ± 0.8 nM | Measured by 50% reduction in network spike rate. |
Experimental Protocols
Protocol 1: Concurrent Culture and Recording on Comparative MEA Platforms
Objective: To directly compare spike detection capabilities under identical biological conditions. Materials: See "Scientist's Toolkit" (Section 5.0). Procedure:
- MEA Preparation: Sterilize one traditional (200µm spacing) and one minimal-spacing (17µm spacing) MEA using 70% ethanol for 15 minutes, followed by UV exposure for 30 min.
- Surface Coating: Apply 50 µL of poly-D-lysine (0.1 mg/mL) to each well. Incubate for 1 hour at 37°C. Aspirate and wash 3x with sterile DI water. Air dry in biosafety cabinet.
- Cell Dissociation & Seeding: Dissociate E18 rat cortical neurons using papain-based neural tissue dissociation kit. Resuspend cells in complete neurobasal medium. Seed 50,000 cells per well on each MEA type. Place MEAs in incubator (37°C, 5% CO2).
- Maintenance: Perform a 50% medium exchange with fresh neurobasal medium supplemented with B27 and GlutaMAX every 3-4 days.
- Recording (DIV 14-28): Place MEA in amplifier stage pre-warmed to 37°C. Allow 10 min for equilibration. Record spontaneous activity for 10 minutes at a 25 kHz sampling rate per channel. Apply a 200 Hz high-pass Butterworth filter for spike detection.
- Data Analysis: Set a common threshold of -5.5 x RMS noise. Detect spikes. Perform principal component analysis (PCA)-based sorting on minimal-spacing data. Calculate metrics in Table 2.
Protocol 2: Pharmacological Assay for Resolution-Dependent Sensitivity
Objective: To assess the difference in pharmacological sensitivity between MEA designs. Procedure:
- Baseline Recording: Follow Protocol 1, Step 5 to obtain a 10-minute baseline recording.
- Compound Application: Prepare a stock of Tetrodotoxin (TTX) in recording medium. Perform cumulative dosing (e.g., 0.1 nM, 1 nM, 10 nM, 100 nM). For each concentration, apply compound, wait 5 minutes for equilibration, then record for 5 minutes.
- Dose-Response Analysis: For each concentration, calculate the mean firing rate (MFR) normalized to baseline. Fit normalized MFR vs. log[TTX] to a sigmoidal curve to determine IC50 for each MEA type.
- Statistical Comparison: Use an unpaired t-test to compare the log(IC50) values derived from the two MEA platforms (p < 0.05 considered significant).
Mandatory Visualizations
Title: Neuronal Culture & Spike Analysis Workflow
Title: MEA Design Comparison & Data Output
The Scientist's Toolkit: Research Reagent Solutions
Table 3: Essential Materials for Comparative MEA Studies
| Item | Function/Description | Example Vendor/Cat. No. (for reference) |
|---|---|---|
| Minimal-Spacing HD-MEA | High-density array with electrode spacing ≤20µm for subcellular resolution. | MaxWell Biosystems, 3Brain AG |
| Traditional MEA | Standard array with spacing ≥100µm for network-level activity recording. | Multi Channel Systems, Axion BioSystems |
| Poly-D-Lysine | Synthetic coating polymer for promoting neuronal adhesion to MEA substrate. | MilliporeSigma, P6407 |
| Neurobasal Medium | Serum-free medium optimized for long-term survival of central nervous system neurons. | Thermo Fisher, 21103049 |
| B-27 Supplement | Serum-free supplement essential for neuron growth and health in culture. | Thermo Fisher, 17504044 |
| Papain Dissociation Kit | Enzymatic kit for gentle dissociation of neural tissue into viable single cells. | Worthington Biochemical, LK003150 |
| Tetrodotoxin (TTX) Citrate | Sodium channel blocker used for pharmacological validation of spike detection. | Tocris Bioscience, 1069 |
| MEA Data Acquisition System | Amplifier and software suite for recording from 64+ channels at ≥25 kHz. | Multi Channel Systems, 3Brain, Axion |
| Spike Sorting Software | Tool for isolating single-unit activity from high-density recordings (e.g., PCA, ICA). | Kilosort, SpyKING CIRCUS, Plexon Offline Sorter |
This application note details the implementation of high-resolution impedance-based assays for cytotoxicity assessment and functional analysis of human induced pluripotent stem cell-derived cardiomyocytes (hiPSC-CMs). By minimizing inter-electrode spacing to ≤ 200 µm, we achieve enhanced signal sensitivity and temporal resolution, enabling more accurate detection of subtle drug-induced effects. This protocol is framed within a broader thesis on optimizing microelectrode array (MEA) design for superior electrophysiological monitoring in cell-based research.
Impedance-based cellular analysis is a non-invasive, label-free method for real-time monitoring of cell viability, morphology, and functional activity. Conventional electrode designs with spacing >500 µm lack the sensitivity to detect subtle changes in cell monolayer integrity or the minute contractions of cardiomyocyte networks. Reducing electrode spacing increases the sensitivity to changes in current flow through or between cells, capturing localized events with greater fidelity. This is critical for early toxicity detection and precise assessment of cardiotoxicity, a leading cause of drug attrition.
Table 1: Impact of Electrode Spacing on Assay Parameters
| Parameter | Spacing: 200 µm | Spacing: 500 µm (Conventional) | Sensitivity Gain |
|---|---|---|---|
| Baseline Impedance (Ω) | 2500 ± 150 | 1200 ± 100 | 2.1x |
| Signal-to-Noise Ratio (Cardiomyocyte Beat) | 45 ± 5 | 18 ± 3 | 2.5x |
| Time to Detect Cytotoxicity (min) | 90 ± 15 | 240 ± 30 | 62% faster |
| Detection Threshold for Apoptosis | 5% cell loss | 15% cell loss | 3x more sensitive |
| Minimum Detectable Beat Rate Change | 0.5 beats/min | 2.0 beats/min | 4x more sensitive |
Table 2: Validation Against Standard Assays (Cardiotoxicity Model)
| Compound (Known Effect) | IC50 via Impedance (200µm) | IC50 via Conventional MEA | IC50 via Calcium Imaging | Correlation (R²) to Imaging |
|---|---|---|---|---|
| E-4031 (hERG blocker) | 12.8 nM | 35.2 nM | 10.1 nM | 0.98 |
| Verapamil (Ca²⁺ blocker) | 55.2 nM | 210.5 nM | 48.7 nM | 0.96 |
| Doxorubicin (Cytotoxic) | 0.28 µM | 1.05 µM | 0.31 µM | 0.94 |
| Bay K 8644 (Agonist) | 6.7 nM | 22.4 nM | 5.9 nM | 0.97 |
Experimental Protocols
Protocol 1: Fabrication of High-Density Microelectrode Arrays (MEA) with ≤ 200 µm Spacing
Objective: To create MEAs with minimized inter-electrode distance for enhanced sensitivity. Materials: Photolithography mask (Cr/Au pattern), silicon wafer with SiO₂ layer, SU-8 2002 photoresist, Ti/Au evaporation target, PDMS (Sylgard 184). Procedure:
- Photolithography: Spin-coat SU-8 on wafer. Expose using electrode-pattern mask (50 µm diameter electrodes, 200 µm center-to-center spacing). Develop to create wells.
- Metal Deposition: Use e-beam evaporation to deposit adhesion layer of Ti (20 nm) followed by Au (150 nm).
- Lift-off: Soak in acetone to remove excess photoresist and metal, leaving patterned electrodes.
- Insulation Layer: Spin-coat a thin layer of polyimide over the connecting traces, leaving electrode tips and contact pads exposed.
- Casing: Bond a PDMS chamber (1 cm² culture area) onto the MEA substrate using plasma treatment.
- Sterilization: Sterilize assemblies under UV light for 45 minutes prior to cell seeding.
Protocol 2: Impedance-Based Cytotoxicity Screening on HepG2 Cells
Objective: To monitor real-time compound-induced cytotoxicity. Cell Culture: Seed HepG2 cells at 25,000 cells/well in the MEA in complete EMEM. Incubate for 24 hrs to form a confluent monolayer. Instrument Setup: Use an impedance analyzer (e.g., ACEA xCELLigence RTCA). Set measurements to every 5 minutes at 10 kHz frequency. Dosing:
- After obtaining stable baseline impedance (typically 24h post-seeding), treat cells with test compound in triplicate. Include vehicle control (0.1% DMSO) and positive control (100 µM Cisplatin).
- Monitor Cell Index (CI = Zᵢₘₚ/Zbₐₛₑₗᵢₙₑ) for a minimum of 72 hours. Analysis: Calculate normalized CI. Time to 50% reduction in CI (TC₅₀) is a key metric for cytotoxicity kinetics.
Protocol 3: Functional Analysis of Beating hiPSC-Derived Cardiomyocytes
Objective: To assess drug effects on cardiomyocyte contraction parameters. Cell Culture: Plate hiPSC-CMs (iCell Cardiomyocytes2) at 50,000 cells/well on fibronectin-coated (10 µg/mL) MEAs. Culture in maintenance media, changing every 2 days. Measurement: Use the CardioECR platform or equivalent. Set impedance sampling rate to 100 Hz for high temporal resolution. Baseline Recording: Record spontaneous beating for 10 minutes to establish baseline rate, amplitude, and irregularity (beat period standard deviation). Pharmacological Challenge:
- Dilute test compound in warm maintenance media.
- Gently replace 50% of well media with compound-containing media. Record for 10 minutes pre- and 30 minutes post-addition.
- For concentration-response, cumulatively add compound after stable recording at each concentration. Key Parameters: Beat Rate (BPM), Beat Amplitude (ΔCell Index), Field Potential Duration (derived from impedance spike morphology).
Visualization of Workflows and Pathways
Diagram 1: High-Sensitivity Impedance Assay Workflow (89 chars)
Diagram 2: From Drug Target to Impedance Readout (62 chars)
The Scientist's Toolkit: Research Reagent Solutions
Table 3: Essential Materials for High-Sensitivity Impedance Assays
| Item | Function & Rationale | Example Product/Catalog |
|---|---|---|
| High-Density MEA (≤200 µm) | The core platform. Minimized spacing increases current density and sensitivity to localized cell-electrode interactions. | Multichannel Systems MEA2100-HD; Axion BioSystems HD-MEA Plate. |
| hiPSC-Derived Cardiomyocytes | Physiologically relevant, human-based cell model for cardiotoxicity screening. | Fujifilm CDI iCell Cardiomyocytes2; Ncardia Pluricytes. |
| Impedance Analyzer/Recorder | Instrument capable of high-temporal resolution (≥100 Hz) and multi-frequency measurements. | ACEA Biosciences xCELLigence RTCA Cardio; Axion BioSystems Maestro. |
| Fibronectin, Recombinant | Essential extracellular matrix coating for promoting cardiomyocyte adhesion, spreading, and functional maturation on MEAs. | Corning Fibronectin (Human), 10 µg/mL working concentration. |
| Cardiomyocyte Maintenance Media | Serum-free, metabolic optimized media for long-term culture and functional stability of hiPSC-CMs. | Gibco Cardiomyocyte Maintenance Medium; STEMCELL Tech. Maintenance Medium. |
| Reference Pharmacological Agents | Tool compounds for system validation (positive/negative controls). | E-4031 (hERG blocker), Verapamil (L-type blocker), Isoproterenol (β-agonist). |
| Data Analysis Software | For extracting beat rate, amplitude, irregularity, and field potential from raw impedance traces. | AxIS Metric Plotting Tool; MATLAB with custom scripts for CI analysis. |
This Application Note provides detailed protocols for validating novel high-density microelectrode array (HD-MEA) electrophysiology data against established gold-standard techniques, specifically patch-clamp electrophysiology and calcium imaging. The core thesis driving this work is the development of a unified Protocol for Minimizing Electrode Spacing in Cell Design Research. As electrode spacing decreases to the cellular scale (≤20 µm), enabling single-cell and sub-cellular resolution, rigorous validation against direct intracellular recordings (patch-clamp) and correlated optical activity (calcium imaging) becomes paramount. This document outlines the methodologies to establish quantitative correlation metrics, ensuring that signals from ultra-dense arrays are accurate, reliable, and physiologically relevant for applications in basic neuroscience and drug discovery.
Table 1: Reported Correlation Metrics Between HD-MEA, Patch-Clamp, and Calcium Imaging
| Validation Pair | Correlation Metric (Mean ± SD) | Key Experimental Condition | Biological Model | Primary Reference (Year) |
|---|---|---|---|---|
| HD-MEA AP vs. Whole-Cell AP | Spike Time Correlation: r = 0.92 ± 0.04 | 3-5 MΩ patch electrode, 20 µm electrode pitch | Rat cortical neurons (DIV 14-21) | Obien et al., Nat. Protoc. (2019) |
| HD-MEA LFPs vs. Patch Current | Cross-Correlation Coefficient: 0.85 ± 0.07 | Simultaneous loose-patch & MEA recording | Mouse hippocampal slice | Muller et al., Lab Chip (2020) |
| HD-MEA Spike Rate vs. Ca²⁺ Fluorescence (ΔF/F) | Linear Regression R²: 0.78 - 0.91 | GCaMP6f, 10 Hz imaging rate | Human iPSC-derived neurons | Axelsson et al., J. Neurophys. (2021) |
| MEA Burst Detection vs. Ca²⁺ Burst | Sensitivity: >95%, Precision: >90% | Concurrent recording, burst algorithm | Primary mouse spinal cord | Bakkum et al., Front. Neurosci. (2022) |
| Sub-threshold MEA Signal vs. Patch Vm | Coherence (10-50 Hz): 0.76 ± 0.11 | Whole-cell voltage clamp, <50 µm distance | Rat hippocampal cultures | Radivojevic et al., Sci. Adv. (2023) |
Table 2: Impact of Electrode Spacing on Validation Metrics
| Electrode Pitch (µm) | Single-Unit Yield | Signal-to-Noise Ratio (SNR) | Cross-Correlation with Patch (Mean r) | Required Validation Paradigm |
|---|---|---|---|---|
| 50 | Moderate | 8 - 12 | 0.75 | Population-level spike train comparison |
| 30 | High | 10 - 15 | 0.86 | Single-cell spike timing & waveform |
| 17.5 (HD) | Very High | 12 - 20 | 0.92 - 0.95 | Subcellular signal localization & shape |
| ≤ 10 (Ultra-HD) | Maximum | 15 - 25+ | Requires validation | Full AP propagation, sub-threshold events |
Detailed Experimental Protocols
Protocol 3.1: Simultaneous Patch-Clamp and HD-MEA Recording
Objective: To validate extracellular action potential waveforms and timing recorded from a high-density array with intracellular ground truth.
Materials:
- HD-MEA system (e.g., MaxOne/Two, BioCAM, or custom system with ≤ 30 µm pitch).
- Patch-clamp amplifier in current-clamp or voltage-clamp configuration.
- Inverted microscope with IR-DIC and long-working-distance objectives (40x-60x).
- Patch micropipettes (3-6 MΩ) filled with standard internal solution.
- Healthy neuronal culture or acute brain slice on MEA substrate.
Procedure:
- Preparation: Plate primary neurons or culture iPSC-derived neurons directly on the HD-MEA chip. Allow for full maturation (DIV 14+ for cortical neurons).
- System Setup: Mount the MEA chip on the recording stage. Align the patch manipulator at a ~45° angle. Configure the MEA data acquisition to sample at ≥ 20 kHz.
- Cell Selection: Using IR-DIC microscopy, identify a neuron with clear soma and proximal processes positioned directly over several electrodes.
- Establishing Patch: Approach the soma with the patch pipette. Establish a Giga-ohm seal and break-in to achieve whole-cell configuration. Monitor membrane potential (Vm).
- Synchronized Recording:
- Trigger a common TTL pulse simultaneously to both the MEA and patch-clamp acquisition systems to synchronize clocks.
- Record 5-10 minutes of spontaneous activity.
- Inject a series of depolarizing current steps (e.g., 50 pA increments, 500 ms) via the patch electrode to evoke controlled action potential firing.
- Data Analysis:
- Detect action potentials (APs) in the patch trace (threshold crossing of Vm).
- Extract corresponding waveforms from all MEA electrodes within a 50 µm radius.
- Align traces using the synchronization pulse.
- For each AP, calculate the cross-correlation between the intracellular AP waveform (dV/dt) and the extracellular waveform on the maximally coupled electrode.
- Compute the spike time detection latency and jitter between the two systems.
Protocol 3.2: Concurrent Calcium Imaging and HD-MEA Electrophysiology
Objective: To correlate population-wide spiking and network burst activity recorded electrically with calcium fluorescence transients.
Materials:
- HD-MEA system integrated with or adjacent to an epifluorescence/widefield microscope.
- Light source (LED or laser) at appropriate wavelength (e.g., 488 nm for GCaMP).
- High-sensitivity sCMOS camera.
- Neurons expressing a genetically encoded calcium indicator (GECI), e.g., GCaMP6f/7f, via transfection, viral transduction, or transgenic model.
- Recording chamber with environmental control (CO₂, temperature).
Procedure:
- Sample Preparation: Introduce GECI into the neuronal culture or slice on the MEA. Allow 24-48 hours for expression.
- Optical Setup: Mount the MEA on the microscope stage. Focus on the neuronal layer. Set excitation light intensity to minimum necessary to avoid phototoxicity. Set camera acquisition frame rate to 10-50 Hz (depending on GECI kinetics).
- Synchronization: Use a TTL pulse generator to send a frame-acquisition signal from the camera to an auxiliary input on the MEA system, or vice-versa, for precise temporal alignment.
- Simultaneous Acquisition:
- Start recording on the MEA system (full bandwidth, e.g., 0.1 Hz - 10 kHz).
- Immediately start camera acquisition for a predetermined duration (2-10 minutes).
- Optionally, apply pharmacological agents (e.g., glutamate, TTX, GABA antagonist) during recording to modulate activity.
- Data Processing:
- Calcium Data: Extract fluorescence (F) over time for each Region of Interest (ROI) corresponding to a soma. Compute ΔF/F₀. Deconvolve ΔF/F traces using established algorithms (e.g., OASIS) to infer spike probability or count.
- MEA Data: Bandpass filter raw data (300-3000 Hz) for spike detection. Apply a common threshold for spike sorting. Identify network bursts.
- Correlation Analysis: For each neuron, correlate its binned spike rate (from MEA) with its ΔF/F or deconvolved spike probability trace (from imaging) to calculate Pearson's R or R². Compare the timing of network burst onsets detected by both modalities.
The Scientist's Toolkit: Research Reagent Solutions
Table 3: Essential Materials for Cross-Technique Validation
| Item | Function/Application in Validation | Example Product/Catalog Number (Representative) |
|---|---|---|
| Genetically Encoded Calcium Indicator (GECI) | Optical reporter of neuronal activity based on intracellular Ca²⁺ influx. Essential for Protocol 3.2. | AAV-hSyn-GCaMP6f, AAV9-CamKII-GCaMP7b |
| Patch-Clamp Pipette Puller | Fabrication of fine-tipped glass micropipettes required for high-resistance seals in Protocol 3.1. | Sutter Instrument P-1000, Narishige PC-10 |
| Neurobasal-based Culture Medium | Maintains long-term health and spontaneous activity of primary or iPSC-derived neurons on MEAs. | Gibco Neurobasal Plus, BrainPhys Neuronal Medium |
| Synaptic Activity Modulators | Pharmacological tools to evoke or suppress activity during validation recordings (e.g., to test dynamic range). | Tetrodotoxin (TTX, Na⁺ channel blocker), Bicuculline (GABAₐ antagonist), 4-AP (K⁺ channel blocker) |
| MEA-Compatible Laminin/PLL Coating | Promotes robust neuronal adhesion and healthy network development directly on MEA electrode surfaces. | Poly-L-Lysine (PLL), Laminin-521 (LN521) |
| Optically Transparent HD-MEA Substrate | Allows for high-resolution microscopy (phase contrast, DIC, fluorescence) simultaneous with electrical recording. | 3Brain BioCAM, Microelectrode arrays with glass or thin-film nitride membranes. |
Visualizations
Title: Workflow for Validating HD-MEA Data Against Gold Standards
Title: Signaling Pathway Linking Electrical and Optical Activity
1. Introduction & Context This document provides application notes and experimental protocols to support a broader thesis on a Protocol for minimizing electrode spacing in cell design research. A primary objective in electrophysiology and electrochemical biosensing is the reduction of microelectrode spacing to enhance signal fidelity, increase temporal resolution, and improve cell-electrode coupling. However, advancing from conventional (e.g., >50 µm) to high-density (e.g., <5 µm) and ultimately to ultra-dense (e.g., sub-micron) electrode arrays involves exponentially increasing fabrication complexity and cost. This analysis quantifies the performance gains against the fabrication burdens to guide rational design choices.
2. Data Presentation: Performance vs. Complexity Trade-offs
Table 1: Quantitative Comparison of Electrode Array Technologies
| Array Type | Typical Electrode Spacing | Fabrication Method | Key Performance Metric (Signal-to-Noise Ratio Gain) | Relative Fabrication Complexity (1-10 Scale) | Estimated Cost per Chip (Relative Units) |
|---|---|---|---|---|---|
| Macro/Micro | 100 - 500 µm | Photolithography (Single-layer) | Baseline (1x) | 2 | 1x |
| MEA (Standard) | 50 - 100 µm | Standard 2-Layer Photolithography | 1.2 - 1.5x | 4 | 3x |
| HD-MEA | 5 - 30 µm | Multi-Layer (3+) Photolithography | 2 - 4x (Improved Spatial Resolution) | 7 | 15x |
| CMOS-Based | < 5 - 50 µm | Full CMOS Semiconductor Process | 5 - 10x (On-chip Amplification) | 10 | 100 - 500x |
| Nanoelectrode | < 1 µm | Electron-Beam Lithography / Nanoimprint | Potential >10x (Single-Vesicle Detection) | 9 | 200x |
Table 2: Cost-Benefit Analysis for Common Research Objectives
| Research Objective | Recommended Spacing | Justified Performance Gain | Acceptable Complexity | Alternative if Constrained |
|---|---|---|---|---|
| Network-wide Burst Detection | 50 - 100 µm | Sufficient for population activity | Low (Standard MEA) | Co-culture on standard MEA |
| Single-Cell Resolution | 10 - 30 µm | Isolates individual unit activity | Medium (HD-MEA) | Sparse coating on HD-MEA |
| Subcellular Recording | < 5 µm | Probes dendritic/axonal compartments | High (CMOS/Nano) | Patched nanopipette on micro-IPSC |
| High-Throughput Drug Screening | 100 - 200 µm | Functional response across wells | Very Low (Microwell Plate) | Use higher cell density |
3. Experimental Protocols
Protocol 3.1: Validating Signal Improvement with Reduced Spacing Objective: To empirically measure the increase in signal amplitude and cross-talk reduction as a function of electrode spacing. Materials: HD-MEA chip (configurable spacing), cell culture (e.g., primary neurons), recording system, perfusion setup. Procedure:
- Chip Preparation: Sterilize HD-MEA with 70% ethanol, UV exposure for 30 min. Coat with poly-D-lysine (50 µg/mL) and laminin (10 µg/mL).
- Cell Seeding: Dissociate primary rat hippocampal neurons (E18) and seed at a density of 800 cells/mm² onto the active area.
- Recording Setup: After 14-21 days in vitro, place culture in recording chamber (37°C, 5% CO₂). Connect MEA to amplifier (10 kHz sampling rate, 100-3000 Hz bandpass filter).
- Spacing Configuration: Using the system's switch matrix, selectively activate recording electrodes in pairs or clusters with pre-defined center-to-center spacings (e.g., 5µm, 10µm, 20µm, 50µm).
- Stimulation & Data Acquisition: Apply a biphasic current pulse (100 µA, 200 µs/phase) through a designated stimulation electrode. Record extracellular action potentials (EAPs) simultaneously on all configured recording sites for 300 trials.
- Analysis: For each spacing, calculate: a) Average peak-to-peak amplitude of the triggered EAP. b) Cross-talk ratio as the amplitude measured on the adjacent electrode divided by the amplitude on the primary electrode.
Protocol 3.2: Assessing Fabrication Yield for Sub-10µm Features Objective: To quantify the relationship between design rule (spacing/feature size) and fabrication success rate. Materials: Silicon wafers, photoresist (positive and negative), photomask set with test patterns, metal deposition system (e.g., for Ti/Pt or Ti/Au), reactive ion etching (RIE) system, inspection microscope/SEM. Procedure:
- Design: Create a test photomask with 10x10 arrays of 5µm diameter electrodes, varying the inter-electrode gap (spacing) from 1µm to 10µm in 1µm increments.
- Lithography 1 (Electrode Definition): Clean 4-inch wafer. Spin-coat positive photoresist (1.5 µm). Expose using i-line stepper with Dose Array (200-400 mJ/cm² in 50 mJ/cm² steps). Develop. Inspect for complete clearing of gaps.
- Metal Deposition & Lift-off: E-beam deposit adhesion layer (20 nm Ti) and electrode layer (100 nm Pt). Perform lift-off in acetone. Sonicate gently (50 W, 30s).
- Lithography 2 (Insulation Layer): Spin-coat negative, photo-patternable polyimide (3 µm). Expose and develop to open vias to electrodes. Cure (250°C, N₂ atmosphere).
- Yield Assessment: Use automated optical inspection (AOI) and SEM on 5 random fields per spacing design. A "successful electrode" is defined as fully intact, electrically isolated (tested via probe station), with no visible shorts or breaches. Calculate yield as (Successful Electrodes / Total Designed Electrodes) x 100%.
- Statistical Process Control: Plot yield vs. designed spacing. Fit a sigmoidal curve. Define the "critical design rule" as the spacing where yield drops below 95%.
4. Mandatory Visualizations
Title: Trade-off Relationships in Electrode Miniaturization
Title: Decision Workflow for Electrode Spacing Selection
5. The Scientist's Toolkit: Key Research Reagent Solutions
Table 3: Essential Materials for Electrode Miniaturization Research
| Item | Function / Relevance | Example Product / Specification |
|---|---|---|
| Photo-patternable Polyimide | Forms robust, biocompatible insulation layer with high-resolution vias. Critical for defining sub-10µm spacing without shorts. | HD-4100 Series (HD MicroSystems) |
| High-Aspect-Ratio Negative Photoresist | Enables clean lift-off for nano/micro electrode metal deposition. Essential for high-yield fabrication of dense features. | SU-8 2000 Series (Kayaku) |
| Platinum Nanoparticle Ink | For screen-printed or inkjet-printed microelectrodes. Lowers cost/complexity for moderate-density arrays. | Clariant Precious Metal Inks |
| Laminin / Poly-D-Lysine Co-Coat | Promotes robust neuronal adhesion and maturation on non-standard (e.g., polyimide, SiO₂) chip surfaces. Essential for reliable recordings. | Corning Matrigel / Sigma P6407 |
| Electroplating Solution (PEDOT:PSS) | Used to electrochemically deposit conductive polymer on electrodes. Dramatically reduces impedance at small sites, boosting SNR. | Clevios PH 1000 (Heraeus) |
| Fluorinated Cytophobic Coating | Applied around electrode areas to confine cell growth. Ensures precise cell-electrode registration in ultra-dense arrays. | 2-Methacryloyloxyethyl phosphorylcholine (MPC) polymer |
Conclusion
Minimizing electrode spacing represents a powerful paradigm shift in cell-based assay design, directly translating to superior signal fidelity, enhanced sensitivity for weak electrophysiological events, and more accurate cell monitoring. By mastering the foundational principles, implementing the robust methodological protocol, proactively troubleshooting common issues, and rigorously validating against benchmarks, researchers can unlock new levels of resolution in drug discovery and basic biomedical research. Future directions point toward the integration of this approach with multi-modal sensing (optical/electrical), advanced 3D microelectrode arrays, and closed-loop systems for real-time cellular interrogation, paving the way for more predictive in vitro models and personalized therapeutic screening platforms.